Consumer M&A Trends: Fall 2021
Published October 27, 2021

Key Insights
- Spurred by the COVID-19 pandemic, 2020 and 2021 brought record levels of outdoor recreation participation.
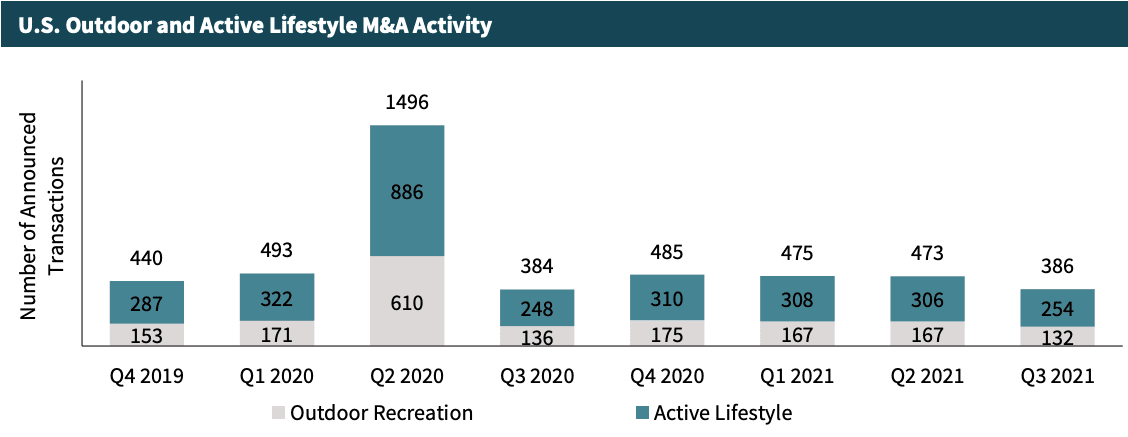
- M&A activity in the sector followed a similar trajectory with a flurry of activity in 2020 and H1 2021.
- Outdoor and Active Lifestyle M&A markets are expected to slow in 2022 due to significant supply chain constraints and normalization in outdoor recreation participation.
Highlights
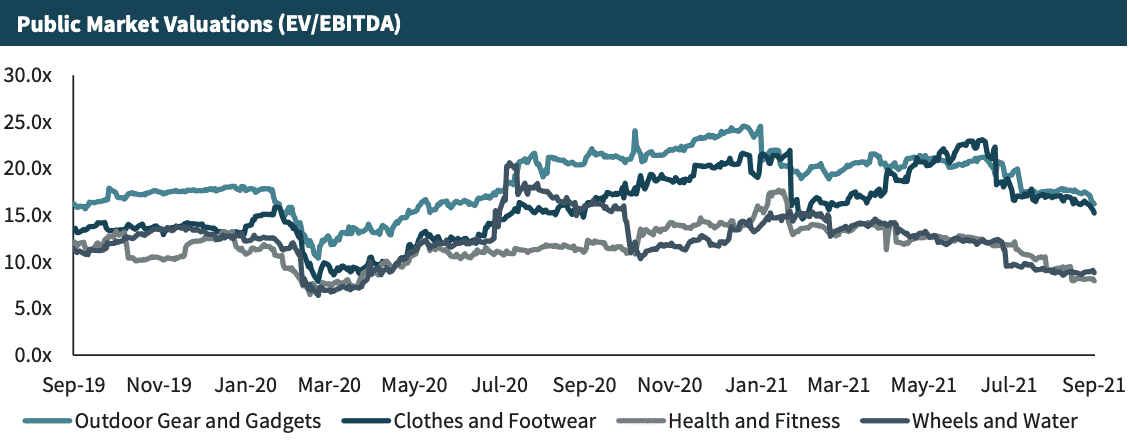
During the pandemic, many consumers have gravitated towards healthier lifestyles and increasingly ventured outside to recreate. M&A activity and subsector valuations experienced an unprecedented rally during the pandemic. Clothing, footwear, and outdoor gear EBITDA multiples climbed from pre- pandemic highs below 15x to nearly 30x in Q2 2021.
With so much activity and competition in the sector, investors have been forced to prioritize opportunities more than ever before. Companies that can prove fundamental and sustainable changes in their businesses, or in consumer behavior, are able to secure meaningful valuation premiums and get ‘credit’ for recent growth.
Activity and valuations have begun normalizing due to significant supply chain constraints which have plagued many businesses around the world throughout 2021, and continue to impact stock price growth for publicly traded companies. These constraints are expected to throttle growth as the outdoor industry continues to see robust demand.
Outdoor and Active Lifestyle Market Insights
Everyone is Going Outside… But Will They Stay?
- Based on the Outdoor Foundation’s 2021 Participation Report, 160.7 million Americans over the age of six participated in at least one outdoor activity, with running, jogging, and trail running being the most popular (63.8M participants), closely followed by hiking (57.8M), fishing (54.7M), and biking (52.7M):
- Although there was a significant increase in year-over-year participant growth, the number of outings and overall intensity (times per week) has steadily declined from 2012 levels, as screen time continues to be a key competitor for outdoor recreation.
- A recent study by the Council to Advance Hunting and the Shooting Sports concluded that 2020 hunting license sales increased approximately 5% over 2019. 35 states saw an overall increase in the number of licenses sold in 2020 when compared to 2021.
- During the pandemic, many consumers have gravitated towards healthier lifestyles and increasingly ventured outside to recreate. Although there was an increase in outdoor recreation, some participants do not expect to continue their new habits:
- Based on a recent special report conducted by Naxion Research, approximately one-quarter of new outdoor recreation participants say they don’t want to continue their outdoor activities, with increased travel, reduced time, and family demands being the main reasons.
- 46% of these participants said they are spending more time online, while 52% said they are spending more time watching TV than they were pre-pandemic.
Outdoor Industry Suffers Slowdown in Q3 2021
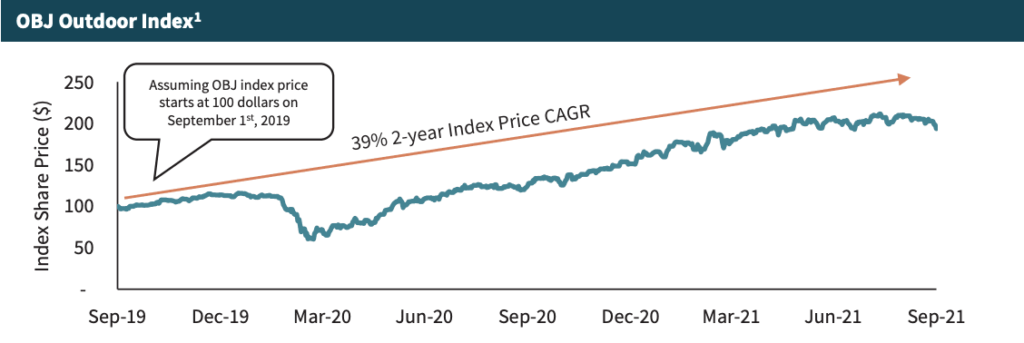
- Significant supply chain constraints have plagued many business around the world throughout 2021 and continue to impact stock price growth for publicly-traded companies. These constraints are expected to throttle growth as the outdoor industry continues to see robust demand:
- Companies within the OBJ Outdoor Index saw a 6% decline in aggregate share price from July to September, down from Q2 (14.9 percent) and Q1 (15.8 percent).
- With the holidays coming up and optimism supply chains will improve over the next few quarters, many outdoor companies will have the opportunity to capitalize on the increased demand over the next 12-18 months.
Source: Outside Business Journal; Outdoor Industry Association; Council to Advance Hunting and the Shooting Sports; Naxion Research Consulting; Southwick; Public Company filings; Meridian Research
Outdoor and Active Lifestyle Middle Market M&A Activity and Trends
Commentary
- Spurred by the COVID-19 pandemic, 2020 and 2021 brought record levels of outdoor recreation participation as travel and indoor restrictions pushed consumers outside to find new hobbies.
- M&A activity in the sector followed a similar trajectory with a flurry of activity early in the pandemic, subsequently returning to more normalized levels in 2021.
- Subsector valuations have seen major separation since Q2 2020. Clothing, footwear, and outdoor gear EBITDA multiples climbed from pre-pandemic highs below 15x to nearly 30x in Q2 2021 before returning to slightly above 15x in Q3 2021. Wheel and watersports companies on the other hand saw enormous multiple growth in Q3-Q4 2020 but have since dropped below pre-pandemic levels in Q3 2021.
With so much activity in the sector, investors have been forced to prioritize opportunities more than ever before. Companies that can prove fundamental and sustainable changes in their businesses, or in consumer behavior, are able to secure meaningful valuation premiums and get ‘credit’ for recent growth.
Recent Transaction Spotlights
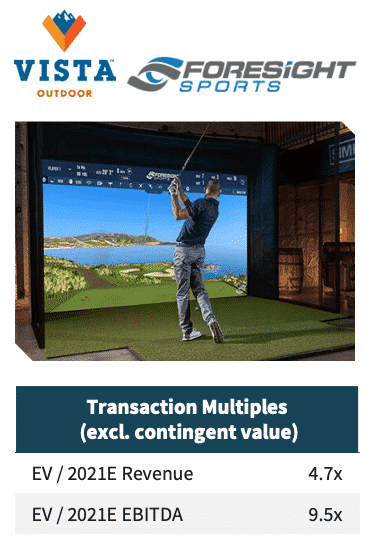
Vista Outdoor (NYSE:VSTO) Acquires Foresight Sports
Announced September 10th, 2021
- In Q2 2021, Vista Outdoor announced its acquisition of Foresight Sports. Vista owns a broad collection of well-established consumer brands across outdoor and shooting sports including Camelbak, Camp Chef, Bushnell, Bell, Giro, Blackhawk, Federal, and Remington.
- Foresight Sports is an award-winning, San Diego-based manufacturer of technology-centric golf analytics, data collection, and performance products including swing monitors, simulators, smart club carts, and more.
- The acquisition significantly strengthens VSTO’s presence and market leadership in the growing golf technology market, bringing Foresight and Bushnell Golf (range finders) together.
- Transaction value was $474 million with up to $25 million in additional contingent proceeds based on performance targets.
Pon Holdings Acquires Dorel Sports from Dorel (TSE: DII.B)
Announced October 11th, 2021
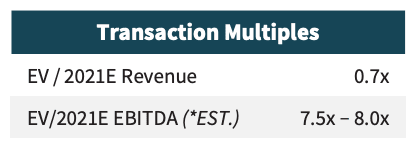
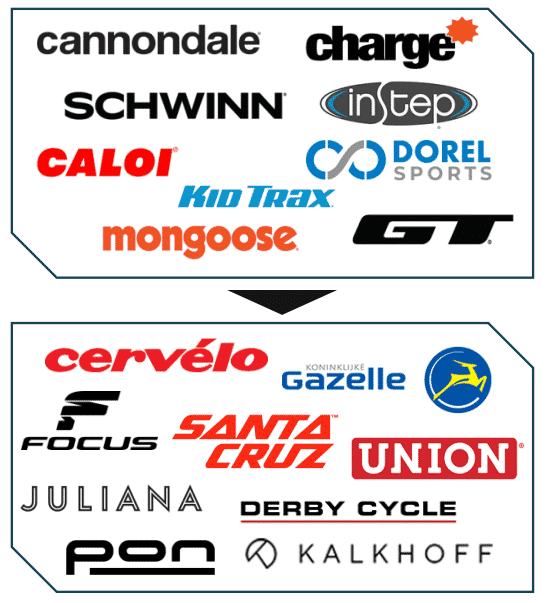
- Netherlands-based Pon Holdings, a collection of renowned cycling brands including Cervelo, Gazelle, and Santa Cruz, has announced its acquisition of Dorel Sports, the cycling division of Canada-based Dorel.
- Dorel Sports is a collection of powerhouse bicycle brands such as Cannondale, GT, Schwinn, and Brazil-based Caloi.
- The combination will create a global leader across urban, sport/racing, MTB, and electric bicycle brands with combined revenue of nearly $3.0B.
- Transaction value was announced at $810M.
Source: Company Press Releases, Meridian Research, Pitchbook, Dorel IR presentation
Public Company Valuations
Clothing and Footwear
| Clothing and Footwear | Market Cap | EV | LTM Rev | LTM EBITDA | LTM EBITDA % | EBITDA | EV / LTM Rev | EV / LTM EBITDA | 52-Week Change |
|---|---|---|---|---|---|---|---|---|---|
| Nike, Inc. | $259,250 | $258,345 | $46,192 | $8,054 | 17.4% | 1.6x | 5.6x | 32.1x | 34.2% |
| Adidas AG | 63,384 | 64,733 | 26,054 | 4,141 | 15.9% | 1.7x | 2.5x | 15.6x | 7.3% |
| Lululemon Athletica, Inc. | 58,426 | 58,050 | 5,524 | 1,352 | 24.5% | 0.6x | 10.5x | 42.9x | 31.3% |
| VF Corp. | 28,376 | 33,857 | 10,357 | 1,354 | 13.1% | 5.1x | 3.3x | 25.0x | 5.7% |
| Moncler S.p.A. | 18,968 | 19,565 | 1,977 | 834 | 42.2% | 1.3x | 9.9x | 23.5x | 71.1% |
| Puma SE | 17,822 | 18,143 | 7,440 | 939 | 12.6% | 1.3x | 2.4x | 19.3x | 33.6% |
| Deckers Outdoor Corporation | 10,450 | 9,725 | 2,767 | 616 | 22.3% | 0.4x | 3.5x | 15.8x | 51.0% |
| Under Armour Inc. | 9,358 | 9,716 | 5,446 | 617 | 11.3% | 2.8x | 1.8x | 15.7x | 61.9% |
| Crocs Inc. | 9,144 | 9,712 | 5,290 | 593 | 11.2% | 6.0x | 1.8x | 16.4x | 67.4% |
| Ralph Lauren | 9,077 | 9,529 | 2,138 | 619 | 28.9% | 1.4x | 4.5x | 15.4x | 186.0% |
| SKECHERS USA Inc | 7,187 | 7,811 | 5,712 | 664 | 11.6% | 2.3x | 1.4x | 11.8x | 38.0% |
| Columbia Sportswear Company | 6,636 | 6,231 | 2,809 | 375 | 13.4% | 1.1x | 2.2x | 16.6x | 7.4% |
| Airwair International Limited | 5,092 | 5,440 | 1,009 | 189 | 18.7% | 2.7x | 5.4x | 28.8x | (17.5%) |
| ASICS Japan Co., Ltd | 4,605 | 4,992 | 3,675 | 261 | 7.1% | 4.0x | 1.4x | 19.1x | 86.7% |
| Canada Goose, Inc. | 4,208 | 4,477 | 727 | n/a | n/a | n/a | 6.2x | n/a | 17.7% |
| Wolverine Worldwide Inc. | 2,713 | 3,254 | 2,145 | (16) | (0.8%) | -53.7x | 1.5x | nm | 23.0% |
| Kathmandu Holdings Ltd | 808 | 978 | 548 | 115 | 20.9% | 3.2x | 1.8x | 8.5x | 41.8% |
| Duluth Holdings Inc. | 485 | 646 | 674 | 78 | 11.6% | 2.3x | 1.0x | 8.2x | (6.2%) |
| Rocky Brands, Inc. | 389 | 570 | 385 | 42 | 10.8% | 4.6x | 1.5x | 13.7x | 110.8% |
| Superdry PLC | 325 | 648 | 732 | 32 | 4.4% | 11.8x | 0.9x | 20.3x | 88.9% |
| Median | $8,132 | $8,670 | $2,788 | $616 | 13.1% | 2.3x | 2.3x | 16.5x | 36.1% |
| Average | $25,835 | $26,321 | $6,580 | $1,098 | 15.6% | 0.0x | 3.4x | 19.4x | 47.0% |
Retailers – Outdoor and Active
| Retailers – Outdoor and Active | Market Cap | EV | LTM Rev | LTM EBITDA | LTM EBITDA % | EBITDA | EV / LTM Rev | EV / LTM EBITDA | 52-Week Change |
|---|---|---|---|---|---|---|---|---|---|
| JD Sports Fashion PLC | $15,462 | $17,569 | $10,173 | $1,664 | 16.4% | 2.1x | 1.7x | 10.6x | 53.2% |
| Canadian Tire Corporation, Limited | 9,059 | 13,933 | 12,543 | 2,057 | 16.4% | 2.9x | 1.1x | 6.8x | 39.2% |
| Sportsdirect.com Retail Limited | 4,576 | 5,956 | 4,861 | 591 | 12.2% | 2.9x | 1.2x | 10.1x | 78.7% |
| Academy Sports and Outdoors, Inc. | 3,944 | 5,270 | 6,318 | 736 | 11.7% | 2.6x | 0.8x | 7.2x | 206.9% |
| Boot Barn Holdings, Inc. | 2,976 | 3,209 | 1,052 | 198 | 18.9% | 1.4x | 3.1x | 16.2x | 211.8% |
| Hibbett Sports, Inc. | 1,158 | 1,235 | 1,634 | 268 | 16.4% | 1.0x | 0.8x | 4.6x | 93.7% |
| Zumiez Inc. | 1,016 | 893 | 1,150 | 183 | 15.9% | 1.6x | 0.8x | 4.9x | 39.9% |
| Sportsman’s Warehouse, Inc. | 780 | 1,091 | 1,513 | 141 | 9.3% | 2.2x | 0.7x | 7.7x | 26.8% |
| Big 5 Sporting Goods Corp. | 558 | 737 | 1,194 | 144 | 12.0% | 2.1x | 0.6x | 5.1x | 231.0% |
| XXL Sport & Vildmark AB | 473 | 779 | 1,136 | 158 | 13.9% | 2.3x | 0.7x | 4.9x | (15.7%) |
| Median | $2,067 | $2,222 | $1,574 | $233 | 14.9% | 2.1x | 0.8x | 7.0x | 66.0% |
| Average | $4,000 | $5,067 | $4,158 | $614 | 14.3% | 2.1x | 1.2x | 7.8x | 96.6% |
Health, Fitness, and Wellness
| Health, Fitness, and Wellness | Market Cap | EV | LTM Rev | LTM EBITDA | LTM EBITDA % | EBITDA | EV / LTM Rev | EV / LTM EBITDA | 52-Week Change |
|---|---|---|---|---|---|---|---|---|---|
| Peloton Interactive, Inc. | $28,298 | $28,203 | $4,022 | ($128) | (3.2%) | -11.9x | 7.0x | nm | (23.5%) |
| Herbalife International of America, Inc. | 5,388 | 7,578 | 5,986 | 895 | 15.0% | 3.4x | 1.3x | 8.5x | (1.1%) |
| Technogym S.p.A | 2,377 | 2,286 | 672 | 129 | 19.2% | 0.0x | 3.4x | 17.7x | 69.4% |
| Medifast, Inc. | 2,373 | 2,197 | 1,271 | 205 | 16.1% | 0.1x | 1.7x | 10.7x | 35.0% |
| Nu Skin Enterprises Inc. | 2,052 | 2,214 | 2,833 | 387 | 13.6% | 1.4x | 0.8x | 5.7x | (20.0%) |
| USANA Health Sciences, Inc. | 1,996 | 1,730 | 1,254 | 217 | 17.3% | 0.0x | 1.4x | 8.0x | 23.8% |
| Johnson Health Tech Co Ltd | 630 | 1,081 | 1,089 | 86 | 7.9% | 5.9x | 1.0x | 12.6x | (13.5%) |
| Midsona AB | 457 | 598 | 451 | 42 | 9.2% | 3.9x | 1.3x | 14.4x | (6.3%) |
| Nautilus, Inc. | 324 | 284 | 735 | 140 | 19.0% | 0.3x | 0.4x | 2.0x | (56.0%) |
| Median | $2,052 | $2,197 | $1,254 | $140 | 15.0% | 0.3x | 1.3x | 9.6x | (6.3%) |
| Average | $4,877 | $5,130 | $2,035 | $219 | 12.7% | 0.3x | 2.0x | 9.9x | 0.9% |
Wheel and Water Products
| Wheel and Water Products | Market Cap | EV | LTM Rev | LTM EBITDA | LTM EBITDA % | EBITDA | EV / LTM Rev | EV / LTM EBITDA | 52-Week Change |
|---|---|---|---|---|---|---|---|---|---|
| Brunswick Corporation | $7,073 | $7,427 | $5,382 | $972 | 18.1% | 1.0x | 1.4x | 7.6x | 41.7% |
| Polaris Industries Inc. | 7,044 | 8,214 | 8,179 | 957 | 11.7% | 1.5x | 1.0x | 8.6x | 25.8% |
| Bombardier Recreational Products, Inc | 6,991 | 8,465 | 5,648 | 1,210 | 21.4% | 1.5x | 1.5x | 7.0x | 56.9% |
| Fox Factory, Inc. | 6,517 | 6,638 | 1,132 | 221 | 19.5% | 1.8x | 5.9x | 30.0x | 81.6% |
| Giant Manufacturing Co. Ltd. | 4,379 | 4,614 | 2,773 | 380 | 13.7% | 1.6x | 1.7x | 12.1x | 23.9% |
| Camping World Holdings, Inc. | 1,663 | 4,040 | 6,432 | 779 | 12.1% | 3.2x | 0.6x | 5.2x | 30.7% |
| Malibu Boats, LLC | 1,414 | 1,525 | 927 | 174 | 18.7% | 0.8x | 1.6x | 8.8x | 24.5% |
| Accell Group NV | 1,149 | 1,333 | 1,572 | 134 | 8.5% | 2.7x | 0.8x | 9.9x | 58.4% |
| Dorel Industries, Inc. | 608 | 1,150 | 2,932 | 210 | 7.1% | 2.9x | 0.4x | 5.5x | 65.6% |
| Marine Products | 492 | 546 | 526 | 87 | 16.5% | 1.1x | 1.0x | 6.3x | 21.7% |
| Median | $3,021 | $4,327 | $2,852 | $301 | 15.1% | 1.6x | 1.2x | 8.1x | 36.2% |
| Average | $3,733 | $4,395 | $3,550 | $512 | 14.7% | 1.8x | 1.6x | 10.1x | 43.1% |
Outdoor Gear and Gadgets
| Outdoor Gear and Gadgets | Market Cap | EV | LTM Rev | LTM EBITDA | LTM EBITDA % | EBITDA | EV / LTM Rev | EV / LTM EBITDA | 52-Week Change |
|---|---|---|---|---|---|---|---|---|---|
| ANTA Sports Products Ltd. | $44,126 | $43,525 | $6,584 | $1,906 | 29.0% | 1.3x | 6.6x | 22.8x | 44.8% |
| Garmin International, Inc. | 30,829 | 28,934 | 4,860 | 1,465 | 30.2% | 0.1x | 6.0x | 19.7x | 64.3% |
| Newell Brands Inc | 9,486 | 14,925 | 10,385 | 1,116 | 10.7% | 5.4x | 1.4x | 13.4x | 33.9% |
| YETI Coolers, LLC | 8,221 | 8,182 | 1,276 | 294 | 23.0% | 0.7x | 6.4x | 27.8x | 79.8% |
| Thule Group AB | 6,134 | 6,194 | 1,190 | 295 | 24.8% | 0.4x | 5.2x | 21.0x | 73.8% |
| Callaway Golf Company | 5,097 | 7,262 | 2,415 | 563 | 23.3% | 4.6x | 3.0x | 12.9x | 75.1% |
| Dometic Group AB (publ) | 4,652 | 5,424 | 2,368 | 425 | 18.0% | 4.5x | 2.3x | 12.8x | 33.3% |
| Acushnet Holdings Corp. | 3,696 | 3,828 | 2,109 | 326 | 15.5% | 1.1x | 1.8x | 11.7x | 47.1% |
| Vista Outdoor Inc | 2,414 | 2,781 | 2,409 | 445 | 18.5% | 1.3x | 1.2x | 6.2x | 90.7% |
| Fenix Outdoor International AG | 2,216 | 2,255 | 702 | 93 | 13.3% | 2.1x | 3.2x | 24.2x | 54.8% |
| Compass Group Management LLC | 1,924 | 3,238 | 1,843 | 233 | 12.6% | 4.2x | 1.8x | 13.9x | 72.7% |
| GoPro, Inc. | 1,333 | 1,297 | 1,092 | 82 | 7.5% | 3.4x | 1.2x | 15.8x | 42.3% |
| Johnson Outdoors Inc. | 1,090 | 886 | 750 | 137 | 18.2% | 0.3x | 1.2x | 6.5x | 24.6% |
| Smith & Wesson Brands Inc | 1,040 | 909 | 1,104 | 365 | 33.1% | 0.1x | 0.8x | 2.5x | 23.9% |
| Clarus Corporation | 952 | 972 | 289 | 26 | 9.0% | 1.0x | 3.4x | 37.3x | 65.9% |
| Rapala VMC Corporation | 425 | 478 | 362 | 58 | 16.0% | 1.6x | 1.3x | 8.3x | 241.8% |
| American Outdoor Brands, Inc. | 323 | 293 | 287 | 44 | 15.5% | 0.6x | 1.0x | 6.6x | 50.7% |
| Escalade, Inc. | 265 | 307 | 312 | 42 | 13.5% | 1.2x | 1.0x | 7.3x | 4.5% |
| Median | $2,315 | $3,009 | $1,233 | $295 | 17.0% | 1.3x | 1.8x | 13.1x | 52.7% |
| Average | $6,901 | $7,316 | $2,241 | $440 | 18.4% | 1.9x | 2.7x | 15.0x | 62.4% |
Specialty and Other
| Specialty and Other | Market Cap | EV | LTM Rev | LTM EBITDA | LTM EBITDA % | EBITDA | EV/ LTM Rev | EV / LTM EBITDA | 52-Week Change |
|---|---|---|---|---|---|---|---|---|---|
| Vail Resorts, Inc. | $14,211 | $16,278 | $1,910 | $529 | 27.7% | 5.8x | 8.5x | 30.8x | 52.2% |
| Traeger Pellet Grills, LLC | 2,252 | 2,683 | 727 | 114 | 15.6% | 4.5x | 3.7x | 23.6x | (12.9%) |
| Weber-Stephen Products, LLC | 905 | 2,075 | 2,000 | 195 | 9.7% | 6.8x | 1.0x | 10.7x | 4.4% |
| Fusheng Co., Ltd | 876 | 900 | 697 | 109 | 15.6% | 0.8x | 1.3x | 8.3x | 6.2% |
| Median | $1,578 | $2,379 | $1,319 | $154 | 15.6% | 5.1x | 2.5x | 17.1x | 5.3% |
| Average | $4,561 | $5,484 | $1,334 | $237 | 17.2% | 4.4x | 3.6x | 18.3x | 12.5% |
Select Consumer M&A Transactions
| Date | Target | Buyer | Description | EV | EV / LTM Rev | EV / LTM EBITDA |
|---|---|---|---|---|---|---|
| 21-Sep | WSS | Foot Locker | Retailer of footwear and accessories | $750 | 1.8x | – |
| 21-Sep | EGO Movement | TVS Motor Company | Developer of an e-bike – equipped with IoT functionality | $23 | 2.1x | – |
| 21-Sep | Northcore | Internet Fusion Group | Retailer of surf accessories and clothing | $6 | 1.8x | 10.1x |
| 21-Sep | Chubbies Shorts | Solo Stove | Designer and supplier of men’s shorts | – | – | – |
| 21-Aug | Barletta Pontoon Boats | Winnebago Industries | Manufacturer of pontoon boats | $320 | 1.5x | 12.1x |
| 21-Aug | Trekitt | Frilufts Retail Europé | Retailer of outdoor equipment and clothing | $12 | – | – |
| 21-Aug | Seajacks International | Scorpio Bulkers | Provider of lift boats | $500 | 2.2x | 4.0x |
| 21-Aug | Simply Hike | Astbury Collections | Retailer of skiwear and clothing | – | – | – |
| 21-Aug | Sweaty Betty | Wolverine World Wide | Manufacturer and retailer of women’s sportswear and activewear | $410 | 1.6x | – |
| 21-Jul | Arcata | Mark Loughmiller | California-based paddlesports apparel and gear brand | – | – | – |
| 21-Jul | Klymit | MacNeill Pride Group | Manufacturer of outdoor camping products | – | – | – |
| 21-Jul | TaylorMade | Centroid Investment Partners | Manufacturer of golf equipment and accessories | $1,700 | – | 12.8x |
| 21-Jul | SWEAT | iFit | Operator of online health and fitness platform | $300 | 3.0x | – |
| 21-Jun | Mammut Sports Group | Telemos Capital | Retailer of outdoor clothing brand | $253 | 1.1x | – |
| 21-Jun | Superfeet | Westward Partners | Washington-based insole brand | – | – | – |
| 21-Jun | Rhino-Rack | Clarus | Manufacturer of roof racks and accessories | $198 | 2.2x | 11.9x |
| 21-May | Marine Store | Nimbus Group | Dealer of motor boats | $21 | 0.6x | 5.6x |
| 21-May | GCI Outdoor | MacNeill Pride Group | Manufacturer of outdoor and waterside rockers, chairs, tables and gears | – | – | – |
| 21-Apr | Stoke Park | Reliance | Operator of a hotel and leisure estate | $79 | – | – |
| 21-Apr | Knee Deep Limited | Stevia Nutra Corporation | Manufacturer and designer of insulated clothing | – | – | – |
| 21-Apr | Bike Evasion Sports | M-Way | Offers electric bikes, bicycles, bicycles parts and accessories | – | – | – |
| 21-Apr | Sandaya | InfraVia | Operator of campsites and other leisure facilities | $517 | – | – |
| 21-Mar | DUX Waterfowl | Made By Influence | Manufacturer of apparel and accessories | – | – | – |
| 21-Mar | Topgolf Entertainment Group | Callaway Golf | Operator of sports entertainment company | $2,000 | – | – |
| 21-Mar | Canyon Bicycles | Groupe Bruxelles Lambert | Designer and manufacturer of bicycles and related products | $805 | 1.8x | 11.8x |
| 21-Feb | Shively Sporting Goods | BSN Sports | Provides sports equipment and accessories | – | – | – |
| 21-Feb | GunBroker.com | AMMO | Provides an online platform to find hunting accessories | $240 | 4.0x | 6.0x |
| 21-Jan | Maverick Boat Group | Malibu Boats | Manufacturers and designs center and dual console, flats, and bay boats | $150 | 1.3x | – |
| 20-Dec | Sportsman’s | Great Outdoors Groups | Offers outdoor sporting goods including camping and fishing products | $1,083 | 0.9x | – |
| 20-Oct | TCX Boots | Dainese | Manufacturer of motorcycle gear and accessories in Italy | $16 | 0.7x | 6.9x |
| 20-Apr | Clubhouse Golf | all4golf | Retailer of golf-related equipment and accessories | $72 | 1.9x | – |
| 20-Apr | Marucci Sports | Compass Diversified | Manufacturer of sporting goods | $200 | – | 13.3x |
| 19-Nov | Ciesse Piumini | Mittel | Manufacturer of outerwear clothing | $18 | 0.6x | 3.4x |
| 19-Oct | Rip Curl International | Kathmandu Holdings | Manufacturer of surfing wet-suits | $350 | 0.8x | 7.1x |
| 19-Sep | Peak Resorts | Vail Resorts | Operates ski resorts | $250 | 1.3x | 5.7x |
| 19-Sep | Fox International Group | Lew’s Fishing | Manufacturer and retailer of fishing equipment and supplies | $185 | 2.9x | 15.0x |
| 19-Jun | Merlin Entertainments | KIRKBI | Operator of entertainment centers | $6,047 | – | 12.0x |
| 19-May | Away Resorts | Freshstream Investment Partners | Operator of a chain of holiday resorts | $129 | 1.5x | 8.0x |
| Median | $245 | 1.6x | 9.0x | |||
| Average | $594 | 1.7x | 9.1x |

