Technology, Software, SaaS M&A Trends: Winter 2021
Published April 22, 2021

- SaaS market segment is expected to grow to $120.9B in 2021 as the shift to cloud-based infrastructure continues
- Increased usage of SaaS platforms by small and midsize businesses (“SMBs”) provided additional fuel for growth in 2020
- Special Purpose Acquisition Companies (“SPACs”) and reverse mergers provided an alternative to IPO’s for access to public
The change to cloud-based infrastructure and applications will continue to accelerate as businesses look to stay competitive and productive in a changing environment.
The 12 SaaS companies that went public in 2020 experienced an average IPO “pop” (IPO issue price vs. close price on IPO date) of 73%. Five out of twelve companies popped over 100% and only one company (Palantir) had a first day closing price below the IPO issue price.
APIs are a key engine of growth; acting as the scalable, digital connective tissue that allows enterprises to quickly leverage the power of dedicated platforms; boosting operational efficiency and enabling enterprises to focus on delivering value to their customers.
Software / SaaS Market Insights
Digital Transformation Accelerates
- Digital transformation is accelerating, due in part to the COVID-19 pandemic and the resulting increase in reliance on digital technology for work, socialization, commerce, and entertainment.
- Over the next 10 years, the SaaS industry is expected to unleash enormous gains in productivity and grow at a compounded annual rate of 21%, generating $780 billion in revenue by 20301.
- As demand for digital transformation and new technologies, such as collaboration tools, continues, the SaaS market segment, the largest in the public cloud services market, is expected to grow to $120.9B in 2021, an increase of 15% from 2020.
- The growth in the SaaS space is being partly fueled by increased usage of SaaS platforms by small and midsize businesses (“SMBs”). SMBs average 5-year spend in 2019 was $220k, up from only $55k in 2016, as nearly a third of SMBs spent more than $1.2mm on SaaS.
- The change to cloud-based infrastructure and applications will continue to accelerate as businesses look to stay competitive and productive in a changing environment.
Software Continues to Drive Innovation, Operational Efficiency, and Productivity
- APIs are one of the key engines of growth; acting as the scalable, digital connective tissue that allows enterprises to quickly leverage the power of dedicated platforms; boosting operational efficiency and enabling enterprises to focus on delivering value to their customers.
- The continued adoption of the cloud by enterprises is creating an abundance of opportunities for infrastructure software and security companies that tackle the multitude of complexities and risks associated with executing a successful and value-add cloud strategy.
SPACs Continue to Gain Popularity
- Special Purpose Acquisition Companies (“SPACs”) and reverse mergers went mainstream in 2020 as several Tech companies used a SPAC to reach public markets for the first time. SPACs allow companies to deal with only one investor in lieu of a typical multi-investor road show.
- Reverse mergers are particularly well suited for the Tech industry due to the spread between private and public market valuations for high growth companies with limited profitability. Additionally, SPAC listings typically receive less scrutiny, which is beneficial for high growth companies in need of capital and access to liquidity.
- High investor demand for SPACs during 2020 led to more than $40B of capital flowing into registered SPACs. The inflow of capital allowed SPACs to upsize the amount raised for their IPOs, allowing for larger targets to be acquired.
- Coming off the success of SPACs in 2020, investors will need to race to find appropriate targets in 2021 as SPAC managers must make an acquisition before the commitment period expires (typically 12-24mo).
1 Sources: Ark-Invest, business.com, Pitchbook
Software / SaaS Market M&A Spotlight

Salesforce Acquires Slack for $27.7B – EV / Revenue: 31.33X
Target Description:
Slack provides a channel-based enterprise communication and collaboration platform
Investment Rationale:
Slack struggled as a standalone product against Microsoft Teams – which acts as a fully-integrated front-end for an integrated enterprise product. Slack allows Salesforce to become a more fully-integrated platform by providing an intuitive interface and system of productivity that aligns with the new way to work.

Twilio Acquires Segment for $3.2B – EV / Revenue: n/a
Target Description:
Segment provides a customer data platform that facilitates data accessibility and reliability through uniform collection processes and unified user records
Investment Rationale:
Twilio focuses on external communications and engagement with customers, while Segment focuses internally on wrangling data to better understand customers. By acquiring Segment, Twilio will be able to provide a more holistic solution for managing customer relationships.

Vista Equity Partners Acquires Pluralsight for $3.5B – EV / Revenue: 8.24X
Target Description:
Pluralsight provides a learning platform focused on professional technology skill development
Investment Rationale:
Pluralsight will be able to leverage Vista’s expertise to further strengthen its market position.
Other Notable Transactions

Sources: Pitchbook, Company Press Releases
Software / SaaS Public Comparables
Communications & Collaboration
| Company | Net Debt | Market Value of Equity | Enterprise Value | 1 Yr Rev Growth % | TTM Revenue | TTM EBITDA | Enterprise Value / TTM Revenue | Enterprise Value / TTM EBITDA |
|---|---|---|---|---|---|---|---|---|
| 8X8 | $275 | $3,976 | $4,251 | 32% | $491 | -$120 | 8.7x | n/a |
| Agora (Communication Software) | -$410 | $5,461 | $5,051 | – | $119 | $4 | 42.3x | n/a |
| Anaplan | -$249 | $9,677 | $9,428 | 33% | $423 | -$120 | 22.3x | n/a |
| Asana | $205 | $5,622 | $5,827 | – | $202 | -$147 | 28.8x | n/a |
| Bandwidth.com | -$2 | $4,492 | $4,490 | 20% | $292 | $5 | 15.4x | n/a |
| Box | $148 | $2,849 | $2,997 | 12% | $755 | -$4 | 4.0x | n/a |
| DocuSign | $311 | $44,781 | $45,092 | 44% | $1,297 | -$130 | 34.8x | n/a |
| Dropbox | $670 | $9,548 | $10,218 | 17% | $1,856 | $249 | 5.5x | 41.0x |
| Everbridge | -$23 | $4,668 | $4,645 | 36% | $253 | -$44 | 18.4x | n/a |
| Five9 | $355 | $10,936 | $11,291 | 30% | $399 | $10 | 28.3x | n/a |
| j2 Global | $1,016 | $4,654 | $5,670 | 9% | $1,426 | $487 | 4.0x | 11.6x |
| Nuance | $1,371 | $13,105 | $14,477 | -3% | $1,479 | $216 | 9.8x | 67.0x |
| RingCentral | $718 | $33,136 | $33,854 | 33% | $1,102 | -$2 | 30.7x | n/a |
| Slack | -$195 | $24,345 | $24,150 | 46% | $834 | -$267 | 29.0x | n/a |
| Smartsheet | -$351 | $8,753 | $8,402 | 45% | $354 | -$106 | 23.7x | n/a |
| Twilio | -$465 | $57,919 | $57,454 | 53% | $1,545 | -$259 | 37.2x | n/a |
| Workiva | -$100 | $4,765 | $4,665 | 20% | $338 | -$43 | 13.8x | n/a |
| Zoom Video Communications | -$660 | $110,506 | $109,846 | 262% | $1,957 | $439 | 56.1x | n/a |
| Median | $8,915 | 32% | $623 | -$23 | 23.0x | 41.0x | ||
| Mean | $20,100 | 43% | $840 | $9 | 22.9x | 39.9x |
Consumer
| Company | Net Debt | Market Value of Equity | Enterprise Value | 1 Yr Rev Growth % | TTM Revenue | TTM EBITDA | Enterprise Value / TTM Revenue | Enterprise Value / TTM EBITDA |
|---|---|---|---|---|---|---|---|---|
| Alphabet | $6,292 | $1,256,822 | $1,263,114 | 2% | $171,704 | $51,481 | 7.4x | 24.5x |
| Apple | $76,033 | $2,301,480 | $2,377,513 | 10% | $294,135 | $84,919 | 8.1x | 28.0x |
| Jamf | -$177 | $4,365 | $4,188 | – | $250 | $19 | 16.7x | n/a |
| Netflix | $8,103 | $238,543 | $246,647 | 24% | $24,996 | $15,508 | 9.9x | 15.9x |
| Peloton | -$826 | $42,660 | $41,834 | 129% | $2,356 | $79 | 17.8x | n/a |
| Spotify | -$693 | $61,699 | $61,006 | 18% | $8,470 | -$640 | 7.2x | n/a |
| Median | $153,827 | 18% | $16,733 | $7,793 | 9.0x | 24.5x | ||
| Mean | $665,717 | 37% | $83,652 | $25,228 | 11.2x | 22.8x |
Consumer Social
| Company | Net Debt | Market Value of Equity | Enterprise Value | 1 Yr Rev Growth % | TTM Revenue | TTM EBITDA | Enterprise Value / TTM Revenue | Enterprise Value / TTM EBITDA |
|---|---|---|---|---|---|---|---|---|
| -$6,922 | $754,633 | $747,711 | 21% | $85,965 | $39,630 | 8.7x | 18.9x | |
| Match Group | $3,122 | $37,642 | $40,764 | 2943% | $2,287 | $738 | 17.8x | 55.2x |
| -$503 | $42,344 | $41,841 | 37% | $1,387 | -$353 | 30.2x | n/a | |
| Snap | $1,154 | $79,163 | $80,317 | 40% | $2,156 | -$931 | 37.2x | n/a |
| Sprout Social | -$92 | $3,554 | $3,462 | 28% | $124 | -$46 | 28.0x | n/a |
| Median | $41,841 | 37% | $2,156 | -$46 | 28.0x | 37.0x | ||
| Mean | $182,819 | 614% | $18,384 | $7,808 | 24.4x | 37.0x |
Data & Analytics
| Company | Net Debt | Market Value of Equity | Enterprise Value | 1 Yr Rev Growth % | TTM Revenue | TTM EBITDA | Enterprise Value / TTM Revenue | Enterprise Value / TTM EBITDA |
|---|---|---|---|---|---|---|---|---|
| Akamai Technologies | $1,966 | $18,360 | $20,326 | 10% | $3,124 | $1,117 | 6.5x | 18.2x |
| Alteryx | $674 | $8,387 | $9,062 | 40% | $491 | $35 | 18.4x | n/a |
| Appian | -$190 | $15,109 | $14,919 | 16% | $292 | -$30 | 51.2x | n/a |
| C3.ai | -$115 | $14,186 | $14,071 | – | $165 | -$55 | 85.4x | n/a |
| Cloudera | $110 | $4,492 | $4,602 | 18% | $854 | -$80 | 5.4x | n/a |
| CommVault Systems | -$352 | $2,967 | $2,616 | 1% | $697 | -$16 | 3.8x | n/a |
| Domo | $22 | $1,983 | $2,004 | 20% | $200 | -$89 | 10.0x | n/a |
| Elasticsearch | -$316 | $13,406 | $13,090 | 49% | $511 | -$119 | 25.6x | n/a |
| MongoDB | $574 | $22,359 | $22,933 | 41% | $543 | -$185 | 42.2x | n/a |
| Nutanix | $645 | $6,284 | $6,929 | 5% | $1,306 | -$868 | 5.3x | n/a |
| Palantir Technologies | -$1,602 | $66,967 | $65,365 | – | $1,000 | -$1,160 | 65.4x | n/a |
| Snowflake | -$3,734 | $77,323 | $73,589 | – | $489 | -$423 | 150.4x | n/a |
| SolarWinds | $1,606 | $5,266 | $6,873 | 11% | $1,001 | $410 | 6.9x | 16.8x |
| Talend | $18 | $1,394 | $1,412 | 16% | $276 | -$55 | 5.1x | n/a |
| Median | $11,076 | 16% | $527 | -$68 | 14.2x | 17.5x | ||
| Mean | $18,414 | 21% | $782 | -$108 | 34.4x | 17.5x |
DevOps
| Company | Net Debt | Market Value of Equity | Enterprise Value | 1 Yr Rev Growth % | TTM Revenue | TTM EBITDA | Enterprise Value / TTM Revenue | Enterprise Value / TTM EBITDA |
|---|---|---|---|---|---|---|---|---|
| Atlassian | -$402 | $56,574 | $56,172 | 31% | $1,710 | -$364 | 32.8x | n/a |
| Datadog | $434 | $30,453 | $30,887 | 74% | $540 | $9 | 57.2x | n/a |
| Dynatrace | $280 | $12,029 | $12,308 | 28% | $618 | $124 | 19.9x | 99.5x |
| Fastly | -$278 | $12,433 | $12,155 | 47% | $267 | -$49 | 45.5x | n/a |
| JFrog | -$324 | $5,894 | $5,570 | – | $139 | -$4 | 40.1x | n/a |
| New Relic | $228 | $4,732 | $4,961 | 18% | $641 | -$112 | 7.7x | n/a |
| PagerDuty | -$90 | $3,993 | $3,903 | 30% | $200 | -$57 | 19.5x | n/a |
| Splunk | $962 | $27,247 | $28,209 | 4% | $2,275 | -$609 | 12.4x | n/a |
| Sumo Logic | -$407 | $3,579 | $3,172 | – | $193 | -$84 | 16.5x | n/a |
| Median | $12,155 | 30% | $540 | -$57 | 19.9x | 99.5x | ||
| Mean | $17,482 | 33% | $732 | -$127 | 28.0x | 99.5x |
Ecommerce
| Company | Net Debt | Market Value of Equity | Enterprise Value | 1 Yr Rev Growth % | TTM Revenue | TTM EBITDA | Enterprise Value / TTM Revenue | Enterprise Value / TTM EBITDA |
|---|---|---|---|---|---|---|---|---|
| Amazon.com | $51,588 | $1,624,480 | $1,676,068 | 31% | $347,945 | $45,291 | 4.8x | 37.0x |
| BigCommerce | -$140 | $5,473 | $5,333 | – | $140 | -$27 | 38.0x | n/a |
| Chewy | -$182 | $42,895 | $42,713 | 36% | $6,458 | -$140 | 6.6x | n/a |
| eBay | $7,171 | $38,906 | $46,077 | 34% | $9,639 | $3,218 | 4.8x | 14.3x |
| Etsy | -$35 | $25,522 | $25,487 | 83% | $1,378 | $326 | 18.5x | 78.2x |
| Farfetch | -$136 | $20,637 | $20,502 | 82% | $1,516 | -$889 | 13.5x | n/a |
| Mercari | -$753 | $7,749 | $6,996 | 51% | $778 | – | 9.0x | – |
| Shopify | -$2,187 | $136,364 | $134,177 | 73% | $2,457 | $146 | 54.6x | n/a |
| SmileDirectClub | $75 | $5,270 | $5,344 | -2% | $669 | -$255 | 8.0x | n/a |
| Stitch Fix | -$35 | $10,473 | $10,438 | 6% | $1,757 | -$47 | 5.9x | n/a |
| The RealReal | -$68 | $2,220 | $2,152 | 4% | $306 | -$135 | 7.0x | n/a |
| Median | $20,502 | 35% | $1,516 | -$37 | 8.0x | 37.0x | ||
| Mean | $179,572 | 40% | $33,913 | $4,749 | 15.5x | 43.2x |
Education
Financial
Food Delivery
Healthcare
Human Capital Management
Internet
Other
Supply Chain & ERP
Sales & Marketing
Security
Travel
Software / SaaS Public Market Insights
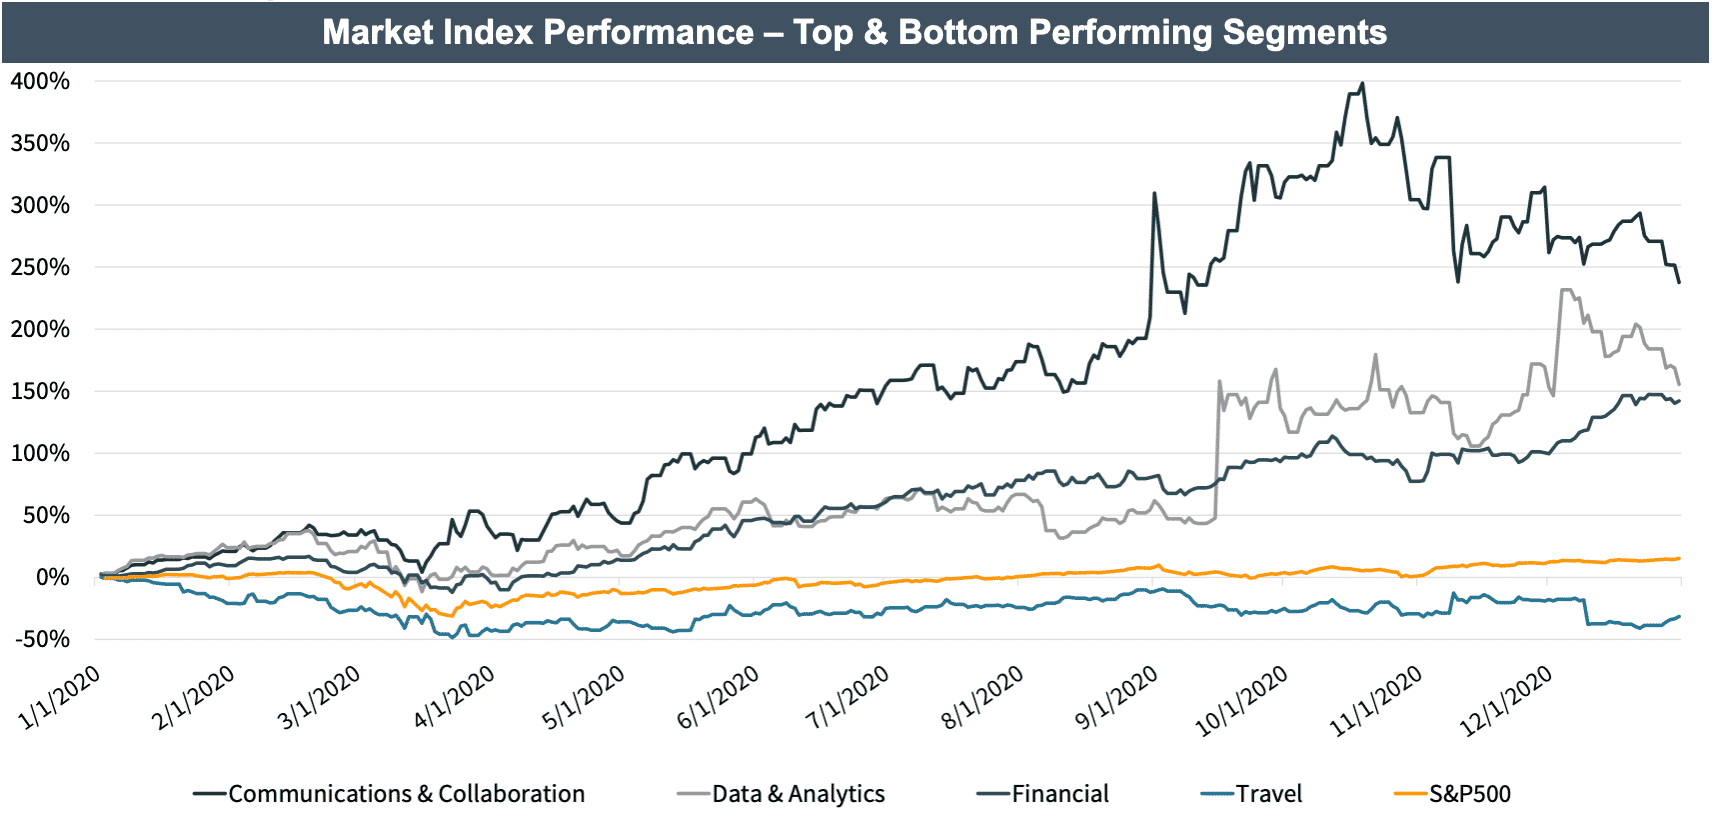
Key Takeaway: Companies in the SaaS space largely outperformed the S&P500 this year, with average index growth of 73%, compared to the S&P500, which grew ~15%. SaaS companies focusing on Communication & Collaboration tools led the way, with the index growing an astonishing 238% as the market turned to digital tools for work and socialization. SaaS companies in the travel space were on the opposite end of the COVID effect, with the index falling ~32%, as travel halted for the majority of 2020.
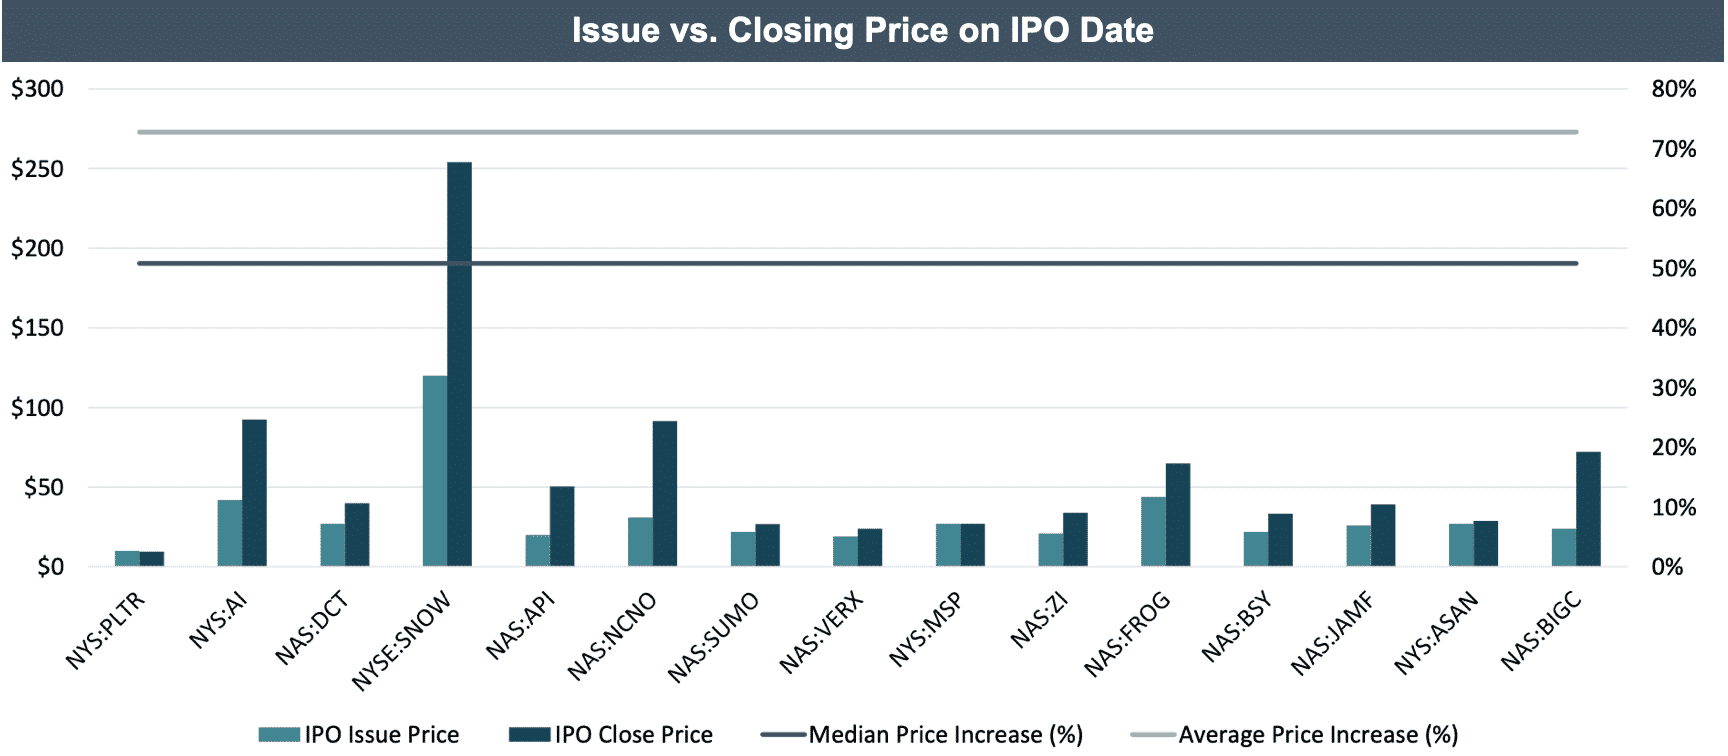
Key Takeaway: SaaS companies going public in 2020 left a lot of money on the table, as IPO mispricing ran rampant. Of the 12 SaaS companies that went public in 2020, the average IPO “pop” (IPO issue price vs. close price on IPO date) was 73% with 5 out of 12 companies popping over 100% and only one company (Palantir) losing value on its first day of trading. Growth continued at a more modest level through the rest of the year, with all of these companies ending the year up from their IPO, averaging 93% growth since issue.
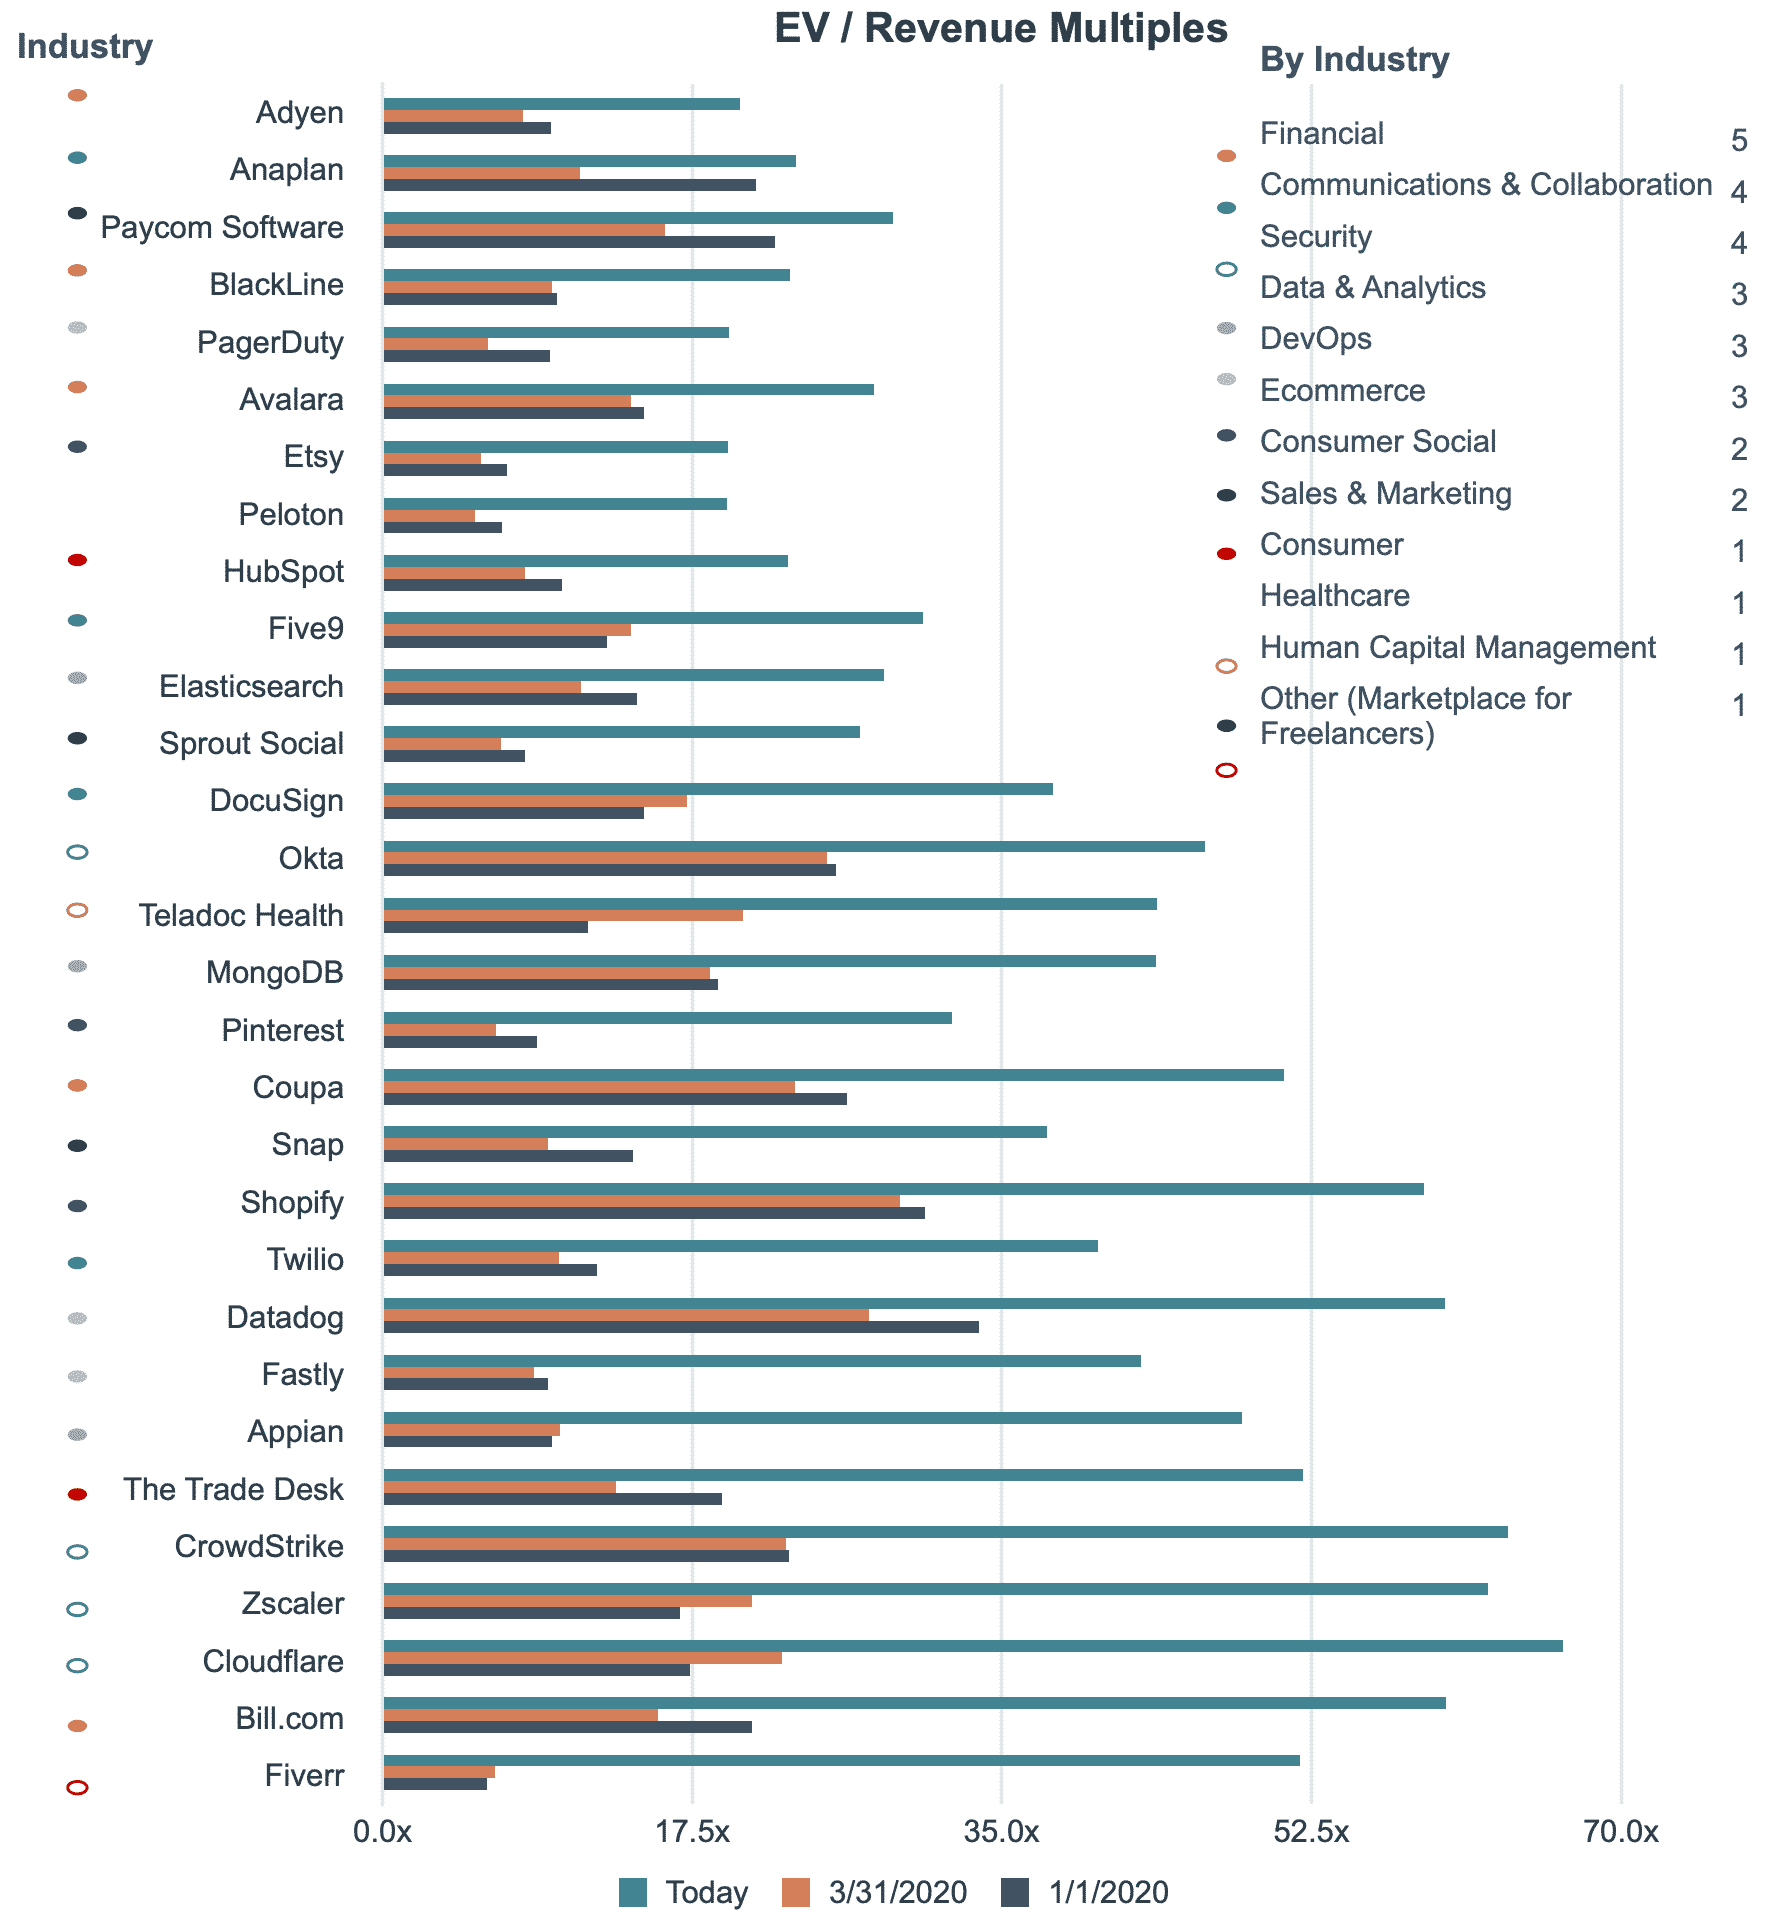
EV/Revenue Multiples by Technology Sub-sector
These companies have seen the strongest multiple expansion since the onset of the pandemic – increasing from an average EV / Revenue multiple of 11.4x at 3/31/2020 to 17.4x today.
Select Recent Software / SaaS M&A Transactions
| Date | Target | Buyer | Description | Enterprise Value ($ in M) | EV / Revenue | EV / EBITDA |
|---|---|---|---|---|---|---|
| Jan-21 | Arena Solutions, Inc. | PTC | Developer of cloud product life cycle management and product development software in the U.S. | $715 | 14.3x | |
| Jan-21 | Capsule Technologies, Inc. | Philips | Developer of medical device integration, clinical surveillance and patient monitoring platform for hospitals and healthcare organizations. | $635 | 6.4x | |
| Jan-21 | Innovation Specialists LLC | Accolade | Provider of a video consultation platform intended to facilitate users in receiving medical opinion and medical decision from medical professionals | $460 | 13.1x | |
| Jan-21 | Streamyard, Inc | Hopin | Developer of a live streaming application intended to share streaming from any browser. | $196 | 8.7x | |
| Dec-20 | PRGX Global, Inc. | Ardian | Provider of recovery auditing and spend analytics services. | $172 | 1.1x | 16.3x |
| Dec-20 | Retail Meetup, LLC | Hyve Group | Provider of online meeting services catering to the retail industry. | $37 | 12.6x | 16.1x |
| Dec-20 | CIPHR Limited | ECI Partners | Developer of human capital management software in the United Kingdom. | $167 | 9.8x | |
| Dec-20 | eOriginal, Inc. | Wolters Kluwer | Developer of a vaulted repository and electronic transaction management software for the mortgage industry. | $280 | 7.9x | |
| Dec-20 | IMImobile Europe Ltd. | Cisco Systems | Developer of a cloud communications software designed to manage business-critical customer interactions at scale. | $670 | 3.2x | 26.7x |
| Dec-20 | Upserve, Inc. | Lightspeed POS | Developer of a restaurant management software designed to make restaurants run smoother operations and exceed guest expectations. | $430 | 10.8x | |
| Nov-20 | ShopKeep Inc. | Lightspeed POS | Developer of a cloud-based point-of-sale technology platform designed to empower independent business owners to run operations with ease. | $440 | 8.8x | |
| Nov-20 | Cradlepoint, Inc. | Ericsson | Developer of cloud-based network solutions intended to connect people, places and equipment over wired and wireless broadband connections. | $1,100 | 6.0x | |
| Nov-20 | Voxbone SA | Bandwidth.com | Provider of cloud-based international voice over internet protocol (VoIP) services based in Brussels, Belgium. | $525 | 6.2x | |
| Oct-20 | Rosetta Stone Ltd. | Cambium Learning Group, Veritas Capital | Developer of interactive language-learning software. | $761 | 4.0x | n/a |
| Oct-20 | Automile, Inc. | ABAX, Investcorp Strategic Capital Group | Developer of an online fleet management software intended to connect vehicle drivers to fleet managers for vehicle and equipment tracking. | $112 | 5.8x | |
| Oct-20 | YCharts, Inc. | LLR Partners | Developer of an investment research platform designed to democratize investment research. | $203 | 13.5x | |
| Oct-20 | Transaction Tax Resources, Inc. | Avalara | Developer and operator of a website intended for quickly finding tax answers and tax rates. | $377 | 18.9x | |
| Sep-20 | VitalWare, LLC | Health Catalyst | Developer of a cloud-based SaaS platform designed to easily document, code, and audit healthcare records. | $120 | 6.3x | |
| Aug-20 | GlobalSCAPE, Inc. | Charlesbank Capital Partners, HelpSystems, HGGC, Pamplona Capital Management, Split Rock Partners, TA Associates Management | Operator of a company in the secure managed file transfer software industry. | $206 | 5.1x | 11.9x |
| Jul-20 | Fortumo OÜ | Boku | Developer of a digital enablement platform designed for telco bundling, carrier billing, and messaging. | $41 | 5.7x | 17.8x |
| Jun-20 | Eggplant Limited | Keysight Technologies | Developer of an automated software testing tool based in the United Kingdom. | $330 | 5.9x | 36.8x |
| Jun-20 | Ten-X, LLC | CoStar Group | Operator of an online real estate marketplace. | $187 | 3.3x | 12.5x |
| Jun-20 | CyberX, Inc. | Microsoft | Developer of an industrial cybersecurity platform designed to reduce IIoT and ICS risk. | $170 | 5.1x | |
| Jun-20 | Mathway, LLC | Chegg | Operator of an educational website committed to offering unique mathematics education to students. | $116 | 8.9x | |
| May-20 | AppExtremes, LLC | Conga, Thoma Bravo | Provider of an intelligent document automation platform designed to help businesses optimize their customer relationship management (CRM) investments. | $715 | 8.5x | |
| May-20 | Chalice Financial Technology, LLC. | Kingswood Holding | Developer of a membership organization platform designed to empower independent wealth advisors. | $50 | 23.8x | |
| Apr-20 | Telaria, Inc. | Magnite | Developer of video advertising software designed to sell and buy cross-screen video advertising for the world’s leading brands. | $233 | 3.4x | n/a |
| Feb-20 | AffiniPay LLC | TA Associates Management | Provider of merchant account and online payment gateway services. | $600 | 12.6x | 20.0x |
| Feb-20 | VersaPay Corporation | Great Hill Partners | Provider of cloud based cash invoice services intended to make money transfer faster. | $85 | 14.6x | -10.2x |
| Feb-20 | Care.com, Inc. | Match Group | Provider of online marketplace for connecting people seeking care services. | $485 | 2.3x | -31.0x |
| Feb-20 | CDT Technologies, Ltd. | Realtime Electronic Payments | Developer of a cloud-based transaction management platform. | $50 | 4.2x | 11.8x |
| Median | $233 | 6.4x | 16.1x | |||
| Mean | $344 | 8.4x | 11.7x |
