Food & Beverage M&A Trends: Winter 2021
Published April 21, 2021
- After a year of uncertainty, Food & Beverage M&A activity is expected to rebound in 2021
- COVID-19 has established a new “normal” for consumer trends
- Food market prices saw the highest inflation in nearly a decade
In 2H20, when capital markets stabilized, reducing capital uncertainty, M&A activity rebounded, resulting in only a 13% decrease in total closed deals in 2020 compared to 2019. With significant available capital and low interest rates, the 2H20 rebound is expected to continue through 2021 as buyers pursue targets to build scale and broaden distribution reach.
COVID-19 has established a new paradigm for the consumer revolving around the home (eat at home, work from home, leisure at home) resulting in online grocery sales increasing over 22% from the same period last year. More than 55% of all consumers are eating at home more often since the pandemic began with many anticipating they will be dining out less in the future, driving growth for fresh food and prepared meals.
With increased consumer spending at grocery stores and restaurant closures, as of October 2020, retail food prices were 4% higher than the same time the prior year, the highest annual food-price inflation since 2011.
Food & Beverage Market Insights
After a Year of Uncertainty, M&A Activity is Expected to Fully Rebound in 2021
- In 2Q20, the Food & Beverage sector experienced a period of uncertainty with many buyers pausing M&A to assess the impact from COVID-19. In 2H20, when capital markets stabilized, reducing capital uncertainty, M&A activity rebounded, resulting in only a 13% decrease in total closed deals in 2020 compared to 2019.
- In 2021, large companies are expected to continue to divest non-core segments and allocate more capital for core acquisitions. This trend started in 2Q20 and is expected to drive additional consolidation within the sector.
- With debt markets stabilizing and significant “dry powder” for investment, private equity investors are increasing their exposure to food and beverage businesses due to the general resiliency of the sector and underlining consumer trends sustaining growth for emerging and trusted brands.
- With significant available capital and low interest rates, the 2H20 rebound is expected to continue through 2021 as buyers pursue deals that build scale and broaden distribution reach.
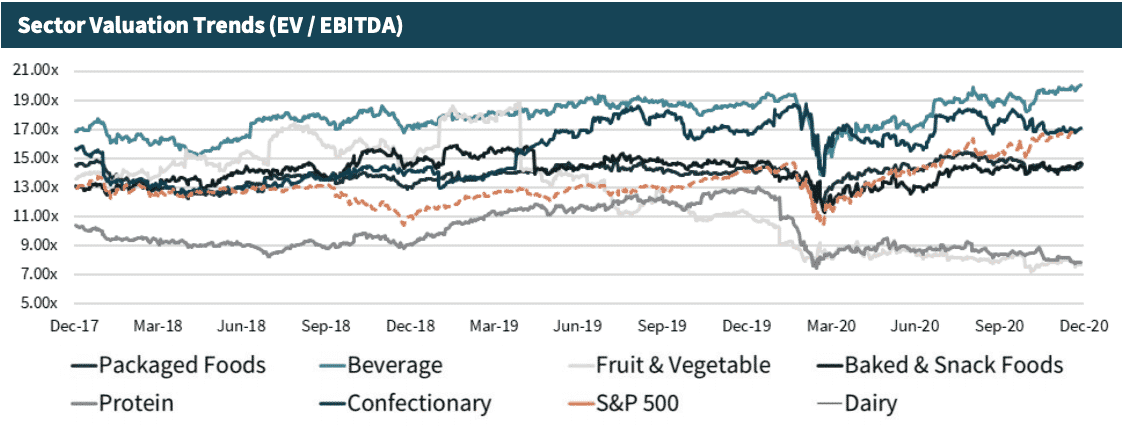
Increasing Valuation Multiples Driven by the Flight to Quality Assets
- Though deal volume has recently decreased, transaction multiples continue to remain at high levels. Scarcity of quality deal flow and competition for quality businesses by buyers and investors armed with ample capital continues to contribute to increased valuation multiples.
- Pushed towards higher valuations, buyers have more closely scrutinized COVID-19 related adjustments and revenue spikes from increased foot and online traffic in the traditional FDM channel.
- Food & Beverage businesses with profitable growth or a tangible recovery story during the pandemic will be attractive to both strategic buyers and private equity investors in 2021; concomitantly, M&A competition will continue to drive premium valuations.
Defining the New “Normal” for Consumer Trends
- COVID-19 has established a new paradigm for the consumer revolving around the home (eat at home, work from home, leisure at home) resulting in online grocery sales increasing over 22% from the same period last year.
- More than 55% of all consumers are eating at home more often since the pandemic began with many anticipating they will be dining out less in the future, driving growth for fresh food and prepared meals.
- Healthy and fresh has not been the only notable trend; comfort foods at home were also a major purchase for consumers in 2020. Food & beverage companies are continuing to explore merging and expanding “better for you” products with traditional products, with examples such as: global flavors, meat and dairy alternatives, and “better for you” alcoholic beverages.
- With consumers more conscious of where their food comes from, the meat and dairy alternatives industry continued its fast-paced growth by expanding in fast-food; most QSR companies are now offering a plant-based alternative product.
Source: PitchBook; Food Industry Executive; Proprietary insight from Meridian Capital Investment Bankers
Food & Beverage M&A Activity

M&A Activity and Market Trends

Description: Flexis Capital and Eurazeo Brands has acquired Austin, Texas-based Waterloo Sparkling Water.
Rationale: Flexis and Eurazeo Brands plan to support the next phase of growth for Waterloo, which is currently sold in over 13,000 stores and online. This transaction provides access to rapidly expanding $4B+ sparkling water category.
Description: French-headquartered Lactalis has entered into a Definitive Agreement to acquire Kraft Heinz’s natural cheese division.
Rationale: Through the acquisition, Lactalis, one of the world’s leading dairy groups, will acquire a portfolio of iconic brands and perpetual licenses for both Kraft and Velveeta in natural and international cheeses.
Description: McCormick & Co. purchased Illinois-based natural flavorings provider FONA International.
Rationale: FONA’s natural portfolio will enhance McCormick’s Flavor Solutions business unit and drive expansion in health and wellness categories. This is McCormick’s second M&A deal in 2Q20 following the acquisition of Cholula Hot Sauce in November.
Source: CapitalIQ, and Meridian Research
Food Market Prices See Highest Inflation in Nearly a Decade
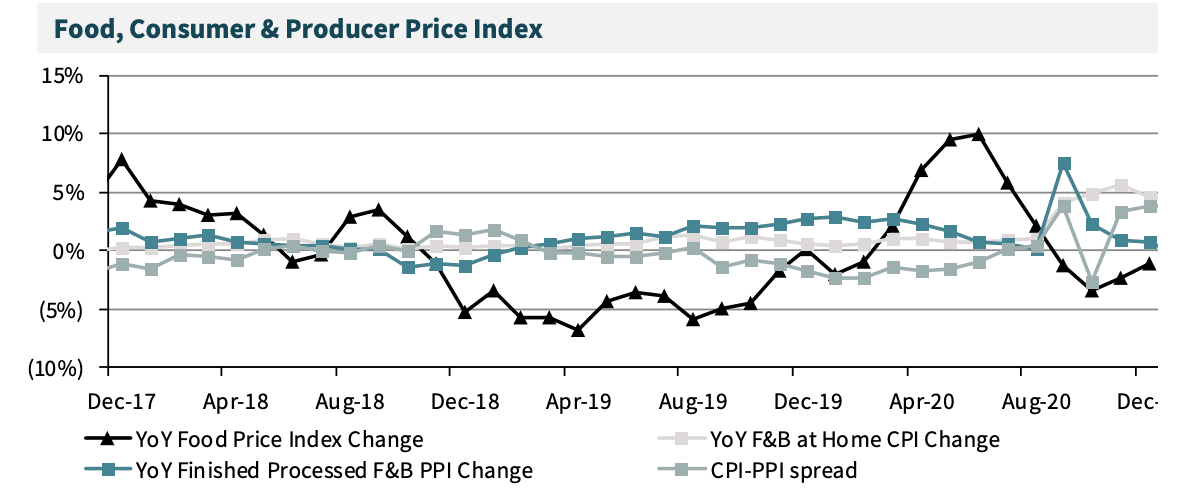
- As of October 2020, retail food prices were 4% higher than the same time the prior year, the highest annual food-price inflation since 2011. From 2000 to 2019, the average annual change in retail grocery prices was approximately 1.9%.
- Meat, dairy, and egg prices have been the biggest drivers of retail inflation with a 6.1% YoY increase as of October 2020.
- The USDA is projecting more modest inflation in 2021; with food at home and food away from home prices increasing between 1-2% and 2-3%, respectively.
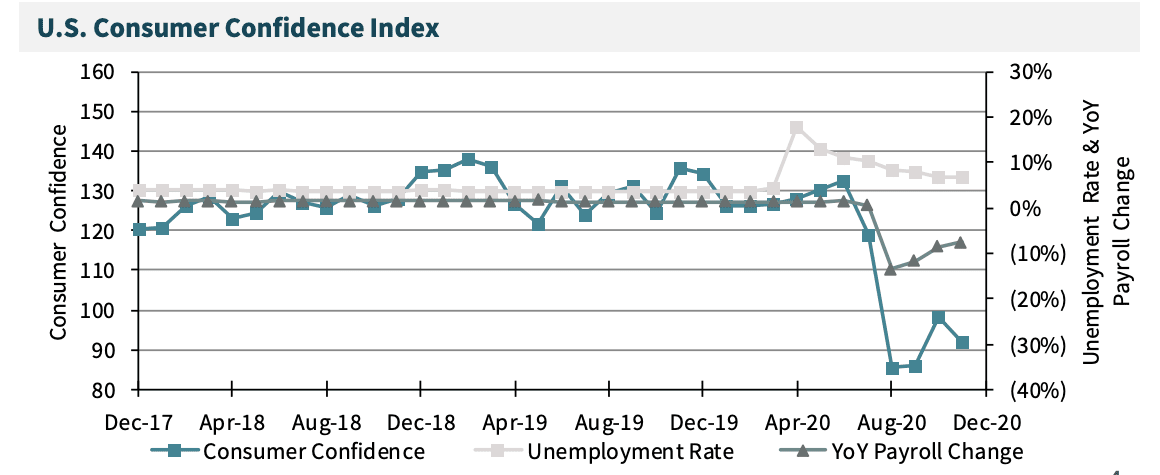
Consumer Confidence Continues to Waver
- 4Q20 saw another decrease in the U.S. Consumer Confidence Index with the resurgence of COVID-19 and related lockdowns.
- Pandemic-related dining restrictions have again increased consumers’ likeliness to cook at home. Consumer spending at grocers was up 11% YoY as of November 2020.
Publicly-traded Food & Beverage Companies
Baked & Snack Foods
| Company Name | Share Price | 52 Week High – Low | Market Cap | Enterprise Value | TTM Sales | TTM EBITDA | TTM EBITDA Margin | NTM Est. Growth Sales | EV / TTM Sales | EV / TTM EBITDA |
|---|---|---|---|---|---|---|---|---|---|---|
| Lancaster Colony Corporation | $178.22 | $184.97 – 114.55 | $4,891 | $4,725 | $1,347 | $209 | 15.5% | 2.2% | 3.5x | 22.7x |
| Flowers Foods, Inc. | 22.86 | 25.18 – 17.42 | 4,863 | 5,930 | 4,283 | 472 | 11.0% | 0.3% | 1.4x | 12.6x |
| J & J Snack Foods Corp. | 155 | 189.17 – 105.67 | 2,961 | 2,744 | 1,022 | 77 | 7.5% | -2.2% | 2.7x | 35.8x |
| John B. Sanfilippo & Son, Inc. | 78.54 | 94.30 – 66.35 | 910 | 976 | 873 | 92 | 10.6% | -1.0% | 1.1x | 10.6x |
| Median | $3,735 | $1,184 | $150 | 10.8% | -0.4% | 2.0x | 17.6x | |||
| Average | $3,594 | $1,881 | $212 | 11.1% | -0.2% | 2.2x | 20.4x |
Beverage
| Company Name | Share Price | 52 Week High – Low | Market Cap | Enterprise Value | TTM Sales | TTM EBITDA | TTM EBITDA Margin | NTM Est. Growth Sales | EV / TTM Sales | EV / TTM EBITDA |
|---|---|---|---|---|---|---|---|---|---|---|
| The Coca-Cola Company | $54.28 | $60.13 – $36.27 | $232,749 | $266,193 | $33,471 | $11,313 | 33.8% | 8.3% | 8.0x | 23.5x |
| PepsiCo, Inc. | 147.54 | 147.60 – 101.42 | 203,023 | 238,001 | 68,557 | 12,583 | 18.4% | 5.8% | 3.5x | 18.9x |
| Monster Beverage Corporation | 91.11 | 90.91 – 50.06 | 47,940 | 46,288 | 4,420 | 1,611 | 36.5% | 12.2% | NM | 28.7x |
| Keurig Dr Pepper Inc. | 32.03 | 32.14 – 18.98 | 45,018 | 59,690 | 11,431 | 3,524 | 30.8% | 3.6% | 5.2x | 16.9x |
| National Beverage Corp. | 86.8 | 100.22 – 35.71 | 4,056 | 3,690 | 1,050 | 225 | 21.4% | 4.5% | 3.5x | 16.4x |
| Primo Water Corporation | 15.74 | 16.59 – 7.21 | 2,558 | 4,121 | 2,488 | 351 | 14.1% | -17.1% | 1.7x | 11.7x |
| Median | $52,989 | $7,925 | $2,568 | 26.1% | 5.1% | 3.5x | 17.9x | |||
| Average | $102,997 | $20,236 | $4,935 | 25.8% | 2.9% | 4.4x | 19.4x |
Confectionary
| Company Name | Share Price | 52 Week High – Low | Market Cap | Enterprise Value | TTM Sales | TTM EBITDA | TTM EBITDA Margin | NTM Est. Growth Sales | EV / TTM Sales | EV / TTM EBITDA |
|---|---|---|---|---|---|---|---|---|---|---|
| The Hershey Company | 152.26 | $161.83 – $109.88 | 31,596 | 35,543 | 8,033 | 2,049 | 25.5% | 2.7% | 4.4x | 17.3x |
| Tootsie Roll Industries, Inc. | 30.03 | 38.92 – 28.99 | 1,967 | 1,810 | 478 | 91 | 19.0% | NA | 3.8x | 20.0x |
| Rocky Mountain Chocolate Factory, Inc. | 4.1 | 9.38 – 2.55 | 24 | 26 | 24 | -1 | NA | NA | 1.1x | NA |
| Median | $1,810 | $478 | $91 | 22.2% | 2.7% | 3.8x | 18.7x | |||
| Average | $12,459 | $2,845 | $713 | 22.2% | 2.7% | 3.1x | 18.7x |
Dairy
| Company Name | Share Price | 52 Week High – Low | Market Cap | Enterprise Value | TTM Sales | TTM EBITDA | TTM EBITDA Margin | NTM Est. Growth Sales | EV / TTM Sales | EV / TTM EBITDA |
|---|---|---|---|---|---|---|---|---|---|---|
| Danone S.A. | $66.81 | $92.06 – $56.38 | $43,382 | $58,910 | $27,941 | $5,726 | 20.5% | 5.1% | 2.1x | 10.3x |
| Glanbia plc | 12.71 | 14.18 – 9.11 | 3,733 | 4,686 | 4,445 | 313 | 7.0% | 5.5% | 1.1x | 15.0x |
| Lifeway Foods, Inc. | 5.63 | 8.89 – 1.43 | 84 | 79 | 100 | 6 | 6.5% | NA | 0.8x | 12.2x |
| Median | $4,686 | $4,445 | $313 | 7.0% | 5.3% | 1.1x | 12.2x | |||
| Average | $21,225 | $10,828 | $2,015 | 11.3% | 5.3% | 1.3x | 12.5x |
Fruit & Vegetable
| Company Name | Share Price | 52 Week High – Low | Market Cap | Enterprise Value | TTM Sales | TTM EBITDA | TTM EBITDA Margin | NTM Est. Growth Sales | EV / TTM Sales | EV / TTM EBITDA |
|---|---|---|---|---|---|---|---|---|---|---|
| Calavo Growers, Inc. | $68.90 | $91.90 – 48.31 | $1,225 | $1,315 | $1,059 | $49 | 4.7% | 1.5% | 1.2x | 26.6x |
| Fresh Del Monte Produce Inc. | 24.38 | 37.47 – 20.25 | 1,198 | 1,962 | 4,225 | 174 | 4.1% | 1.7% | 0.5x | 11.2x |
| Seneca Foods Corporation | 39 | 48.05 – 25.04 | 358 | 597 | 1,379 | 142 | 10.3% | NA | 0.4x | 4.2x |
| Median | $1,315 | $1,379 | $142 | 4.7% | 1.6% | 0.5x | 11.2x | |||
| Average | $1,291 | $2,221 | $122 | 6.4% | 1.6% | 0.7x | 14.0x |
Protein
| Company Name | Share Price | 52 Week High – Low | Market Cap | Enterprise Value | TTM Sales | TTM EBITDA | TTM EBITDA Margin | NTM Est. Growth Sales | EV / TTM Sales | EV / TTM EBITDA |
|---|---|---|---|---|---|---|---|---|---|---|
| Hormel Foods Corporation | $46.73 | $52.97 – $39.01 | $25,495 | $25,127 | $9,608 | $1,342 | 14.0% | 3.0% | 2.6x | 18.7x |
| Tyson Foods, Inc. | 63.49 | 94.24 – 42.57 | 23,486 | 34,066 | 43,185 | 5,013 | 11.6% | 0.7% | 0.8x | 6.8x |
| Pilgrim’s Pride Corporation | 19.66 | 32.99 – 14.06 | 4,813 | 6,975 | 12,038 | 617 | 5.1% | 4.3% | 0.6x | 11.3x |
| Seaboard Corporation | 3,079.81 | 4,320.38 – 2,614.00 | 3,639 | 3,852 | 6,948 | 329 | 4.7% | NA | 0.6x | 11.7x |
| Sanderson Farms, Inc. | 132.65 | 177.31 – 102.13 | 2,987 | 3,004 | 3,564 | 182 | 5.1% | 9.2% | 0.8x | 16.5x |
| Cal-Maine Foods, Inc. | 37.77 | 46.66 – 30.74 | 1,833 | 1,643 | 1,403 | 99 | 7.1% | 1.6% | 1.2x | 16.6x |
| Median | $5,413 | $8,278 | $473 | 6.1% | 3.0% | 0.8x | 14.1x | |||
| Average | $12,444 | $12,791 | $1,264 | 7.9% | 3.8% | 1.1x | 13.6x |
Packaged Foods
| Company Name | Share Price | 52 Week High – Low | Market Cap | Enterprise Value | TTM Sales | TTM EBITDA | TTM EBITDA Margin | NTM Est. Growth Sales | EV / TTM Sales | EV / TTM EBITDA |
|---|---|---|---|---|---|---|---|---|---|---|
| Nestlé S.A. | $118.35 | $127.43 – $94.33 | $329,614 | $368,065 | $93,504 | $18,896 | 20.2% | 1.4% | 3.9x | 19.5x |
| Mondelez International, Inc. | 58.74 | 59.96 – 41.19 | 83,336 | 101,423 | 26,196 | 5,296 | 20.2% | 3.5% | 3.9x | 19.2x |
| The Kraft Heinz Company | 35.03 | 36.37 – 19.99 | 43,049 | 68,973 | 25,782 | 6,766 | 26.2% | -1.8% | 2.7x | 10.2x |
| General Mills, Inc. | 59.34 | 66.14 – 46.59 | 36,289 | 48,561 | 18,287 | 3,979 | 21.8% | -4.0% | 2.7x | 12.2x |
| McCormick & Company, Incorporated | 95.5 | 105.54 – 56.11 | 24,955 | 29,061 | 5,528 | 1,194 | 21.6% | 3.7% | 5.3x | 24.3x |
| Kellogg Company | 62.51 | 72.88 – 52.66 | 21,427 | 29,596 | 13,529 | 2,314 | 17.1% | 1.1% | 2.2x | 12.8x |
| Conagra Brands, Inc. | 36.62 | 39.34 – 22.83 | 17,890 | 27,431 | 11,343 | 2,364 | 20.8% | -5.3% | 2.4x | 11.6x |
| Campbell Soup Company | 48.54 | 57.54 – 40.70 | 14,672 | 20,271 | 8,848 | 1,683 | 19.0% | -5.6% | 2.3x | 12.0x |
| The J. M. Smucker Company | 116.28 | 125.62 – 91.88 | 13,272 | 18,165 | 8,070 | 1,888 | 23.4% | -8.3% | 2.3x | 9.6x |
| Post Holdings, Inc. | 101.21 | 112.38 – 68.97 | 6,682 | 13,140 | 5,699 | 1,069 | 18.8% | 1.5% | 2.3x | 12.3x |
| The Hain Celestial Group, Inc. | 39.93 | 40.62 – 18.12 | 4,058 | 4,416 | 2,070 | 209 | 10.1% | 1.1% | 2.1x | 21.1x |
| TreeHouse Foods, Inc. | 42.66 | 53.98 – 33.50 | 2,407 | 4,510 | 4,312 | 491 | 11.4% | 0.9% | 1.0x | 9.2x |
| B&G Foods, Inc. | 30.41 | 31.93 – 10.39 | 1,942 | 3,726 | 1,928 | 355 | 18.4% | 4.8% | 1.9x | 10.5x |
| SunOpta Inc. | 11.04 | 10.84 – 1.42 | 962 | 1,611 | 1,258 | 75 | 6.0% | 5.8% | 1.3x | 21.4x |
| Farmer Bros. Co. | 4.29 | 15.32 – 3.40 | 73 | 165 | 460 | 19 | 4.0% | 1.0% | 0.4x | 8.9x |
| Median | $20,271 | $8,070 | $1,683 | 19.0% | 1.1% | 2.3x | 12.2x | |||
| Average | $49,274 | $15,121 | $3,107 | 17.3% | 0.0% | 2.4x | 14.3x |
Notable Transactions: Food & Beverage
| Date | Acquirer/Investor | Target | Target Description |
|---|---|---|---|
| Dec-20 | McCormick & Company, Incorporated (NYSE:MKC) | FONA International, Inc. | FONA International, Inc. develops and produces flavors for food, beverage, nutraceutical, and pharmaceutical companies worldwide. |
| Dec-20 | Undisclosed | Beyond Meat, Inc. (NasdaqGS:BYND) | Beyond Meat manufactures, markets, and sells plant-based meat products in the United States and internationally. |
| Dec-20 | Whole Earth Brands, Inc. (NasdaqCM:FREE) | Wholesome Sweeteners, Inc. | Wholesome Sweeteners, Inc. produces, packages, and supplies sweeteners and honey. |
| Dec-20 | Nexus Capital Management LP | Natural Balance Pet Foods, Inc. | Natural Balance Pet Foods, Inc. produces pet food and sells its products through online retailers and distributors. |
| Nov-20 | McCormick & Company, Incorporated (NYSE:MKC) | The Cholula Food Company Inc. | The Cholula Food Company Inc manufactures and distributes hot sauce. |
| Nov-20 | Mars, Incorporated | KIND LLC | KIND LLC manufactures and distributes healthy snacks and fruit and nut bars. |
| Nov-20 | Aphria Inc. (TSX:APHA) | SweetWater Brewing Company, Inc. | SweetWater Brewing Company produces and distributes bottled, canned, and keg beers. |
| Oct-20 | Barilla America, Inc. | Dry pasta of Catelli Foods Corporation | Dry pasta business of Catelli Foods Corporation comprises pasta producing business. |
| Oct-20 | CORE Industrial Partners LLC | J&K Ingredients, Inc. | J&K Ingredients, Inc. manufactures bakery ingredients for the baking industry throughout the world. |
| Oct-20 | B&G Foods North America, Inc. | Crisco® Oils of The J. M. Smucker Company | Crisco® Oils is the vegetable oil brand Crisco and manufacturing facility and warehouse in Ohio. |
| Sep-20 | Groupe Lactalis S.A. | Natural Cheese Business of The Kraft Heinz Company | Comprises of Kraft Heinz’s cheese manufacturing business and brands. |
| Sep-20 | Universal Corporation (NYSE:UVV) | Silva International, Inc. | Silva International engages in the production and sale of dehydrated vegetable, herb, and select fruit ingredients. |
| Aug-20 | Flexis Capital LLC | Waterloo Sparkling Water Corp. | Waterloo Sparkling Water Corp. produces sparkling water. |
| Aug-20 | Trinchero Family Estates, Inc. | Tres Agaves Tequila | Tres Agaves Tequila is a tequila and organic mixers producing business. |
| Aug-20 | Tilia Holdings, LLC | Ellison Bakery Inc | Ellison Bakery Inc produces cookies, crunch toppings, and inclusion items for the ice cream industry. |
| Aug-20 | NaturalShrimp Incorporated | Assets of VeroBlue Farms | Comprises property, equipment, tanks, inventory, permits, contracts, customer lists, and contracts. |
| Aug-20 | Human Brands International, Inc. | Fresh Promise Foods, Inc. | Fresh Promise Foods manufactures, markets, and distributes energy drinks, shakes, bars, and related products. |
| Jul-20 | JBS USA Holdings, Inc. | Processing Facility of Mountain States Rosen | Processing Facility of Mountain States Rosen operates a lamb processing plant. |
| Jul-20 | Sonoma Brands | RSJ Ventures, LLC | RSJ Ventures, LLC produces and sells steak and chicken jerkies online and through stores. |
| Jun-20 | Sazerac Company, Inc. | Paul Masson Grande Amber Brandy Brand | Paul Masson Grande Amber Brandy Brand of Constellation Brands, Inc. comprises distilling business. |
| Jun-20 | KKR & Co. Inc. | Assets of Borden Dairy Company | Nearly All of the Assets of Borden Dairy Company comprises dairy products manufacturing operations. |
| Jun-20 | Black Ridge Oil & Gas, Inc. | Certain Assets of S-FDF LLC | Comprises freeze drier technology, and freeze dried fruits and vegetables for human consumption. |
| Jun-20 | Buitoni Food Company | North American Buitoni® of Nestlé USA, Inc. | North American Buitoni® business of Nestlé USA, Inc. comprises a pasta manufacturing facility. |
| May-20 | Icicle Seafoods, Inc. | Ocean Beauty Seafoods LLC | Processes, produces, and sells seafood products for retail and foodservice customers worldwide. |
| Apr-20 | Ingredion Incorporated | PureCircle Limited | PureCircle Limited engages in the production, marketing, and distribution of natural sweeteners and flavors. |
Meridian Capital Sector Coverage
- Alcoholic & Non-Alcoholic Beverages
- Baked Goods & Snack Foods
- Better-for-you / Natural & Organic
- Branded Food Products
- Foodservice Equipment & Supply
- Ingredients
- Private-Label Manufacturers
- Restaurants
