Food & Beverage M&A Trends: Summer 2021
Published July 20, 2021
Key Insights
- Full hospitality sector recovery unlikely until 2024
- Forced adoption of technology is improving consumer experience
- Extended-stay and “Workation” trends to remain through 2021
A recent survey by the International Food Information Council shows that more than 8 in 10 Americans say they have experienced some change to their habits surrounding eating or food preparation due to the pandemic.
In March, restaurants and bars gained 176,000 jobs. Despite unemployment levels, many restaurants and bars are struggling to build out their labor force as uncertainty of restrictions and virus variants loom.
Throughout 2021 hotels continue to increase the adoption of technology such as online/mobile check-ins and check-outs, mobile keys and room settings controlled by Internet of Things (IoT) technology in order to reduce the spread of germs.
The second half of 2021 is expected to aid the industry’s recovery as group and business travel begins to resume at reduced levels, complimenting the increase in leisure travel following the vaccine rollout.
Restaurant Market Insights
Consumers Care More About Their Health Than They Ever Have(1)
- A recent survey by the International Food Information Council shows that more than 8 in 10 Americans say they have experienced some change to their habits surrounding eating or food preparation due to the pandemic.
- 54% of all consumers, and 63% of those 50+ years in age, care more about the healthfulness of their food and beverage choices in 2020 than they did in 2010;
- Nearly 1 in 5 Americans are using a mobile health monitoring device or app, and two-thirds of those say it has led them to make healthy changes in their lives.
- With the continued consumer focus on healthy and better-for-you options, brands/concepts aligned with these principles will continue to capture market share from unhealthy possibilities of the previous decades.
Forced Adoption of Technology is Improving Consumer Experience(2)
- A recent Panasonic industry survey revealed 100% of food-service providers surveyed said the pandemic has increased their sense of urgency to adopt transformational technologies, and 71% said digital transformation is fundamental, more than any other factor, for business agility.
- As of 2021, 1 in 4 food-service providers believes their company is ahead of the tech curve, while only 1 in 8 believed that a year ago.
- Restaurants are actively trying to adopt these technologies to improve the consumer’s experience and stay ahead or in-line with trends. A significant focus is being placed on improved online ordering, streamlined mobile applications, contactless payments, and service kiosks.
Hospitality Market Insights
Touchless Technology and Internet of Things (IoT) a Continued Priority
- Companies in the hospitality industry are expected to continue to build on the elevated hygiene procedures and minimized touchpoints implemented as a result of the COVID-19 pandemic.
- Throughout 2021 hotels continue to increase the adoption of technology such as online/mobile check-ins and check-outs, mobile keys and room settings controlled by Internet of Things (IoT) technology in order to reduce the spread of germs.
- Hotel owners investing in IoT technology are gathering more data on their guests allowing them to personalize their guests experience, provide location-based services and benefit from predictive repairs & maintenance on building devices and appliances.
Extended-Stay and “Workation” Trends to Remain Through 2021
- While still experiencing a 33.4% YoY revenue decline, the extended-stay sector saw less dramatic decreases than the broader U.S. hotel industry through 2020 as guests favored the additional room capabilities and fewer staff interactions that extended-stay properties provide.
- According to an industry report, 2021 and potentially early 2022 will experience increased demand for longer stays from business travelers as well as rooms that provide high-speed internet and designated workstations that enable productive remote work.
- Capitalizing on remote work flexibility, many chains and boutique hotels are offering staycation packages to cater to employees looking to work remotely outside of their homes.
Sources: (1) International Food Information Council; (2) Panasonic Industry Survey; Meridian Research
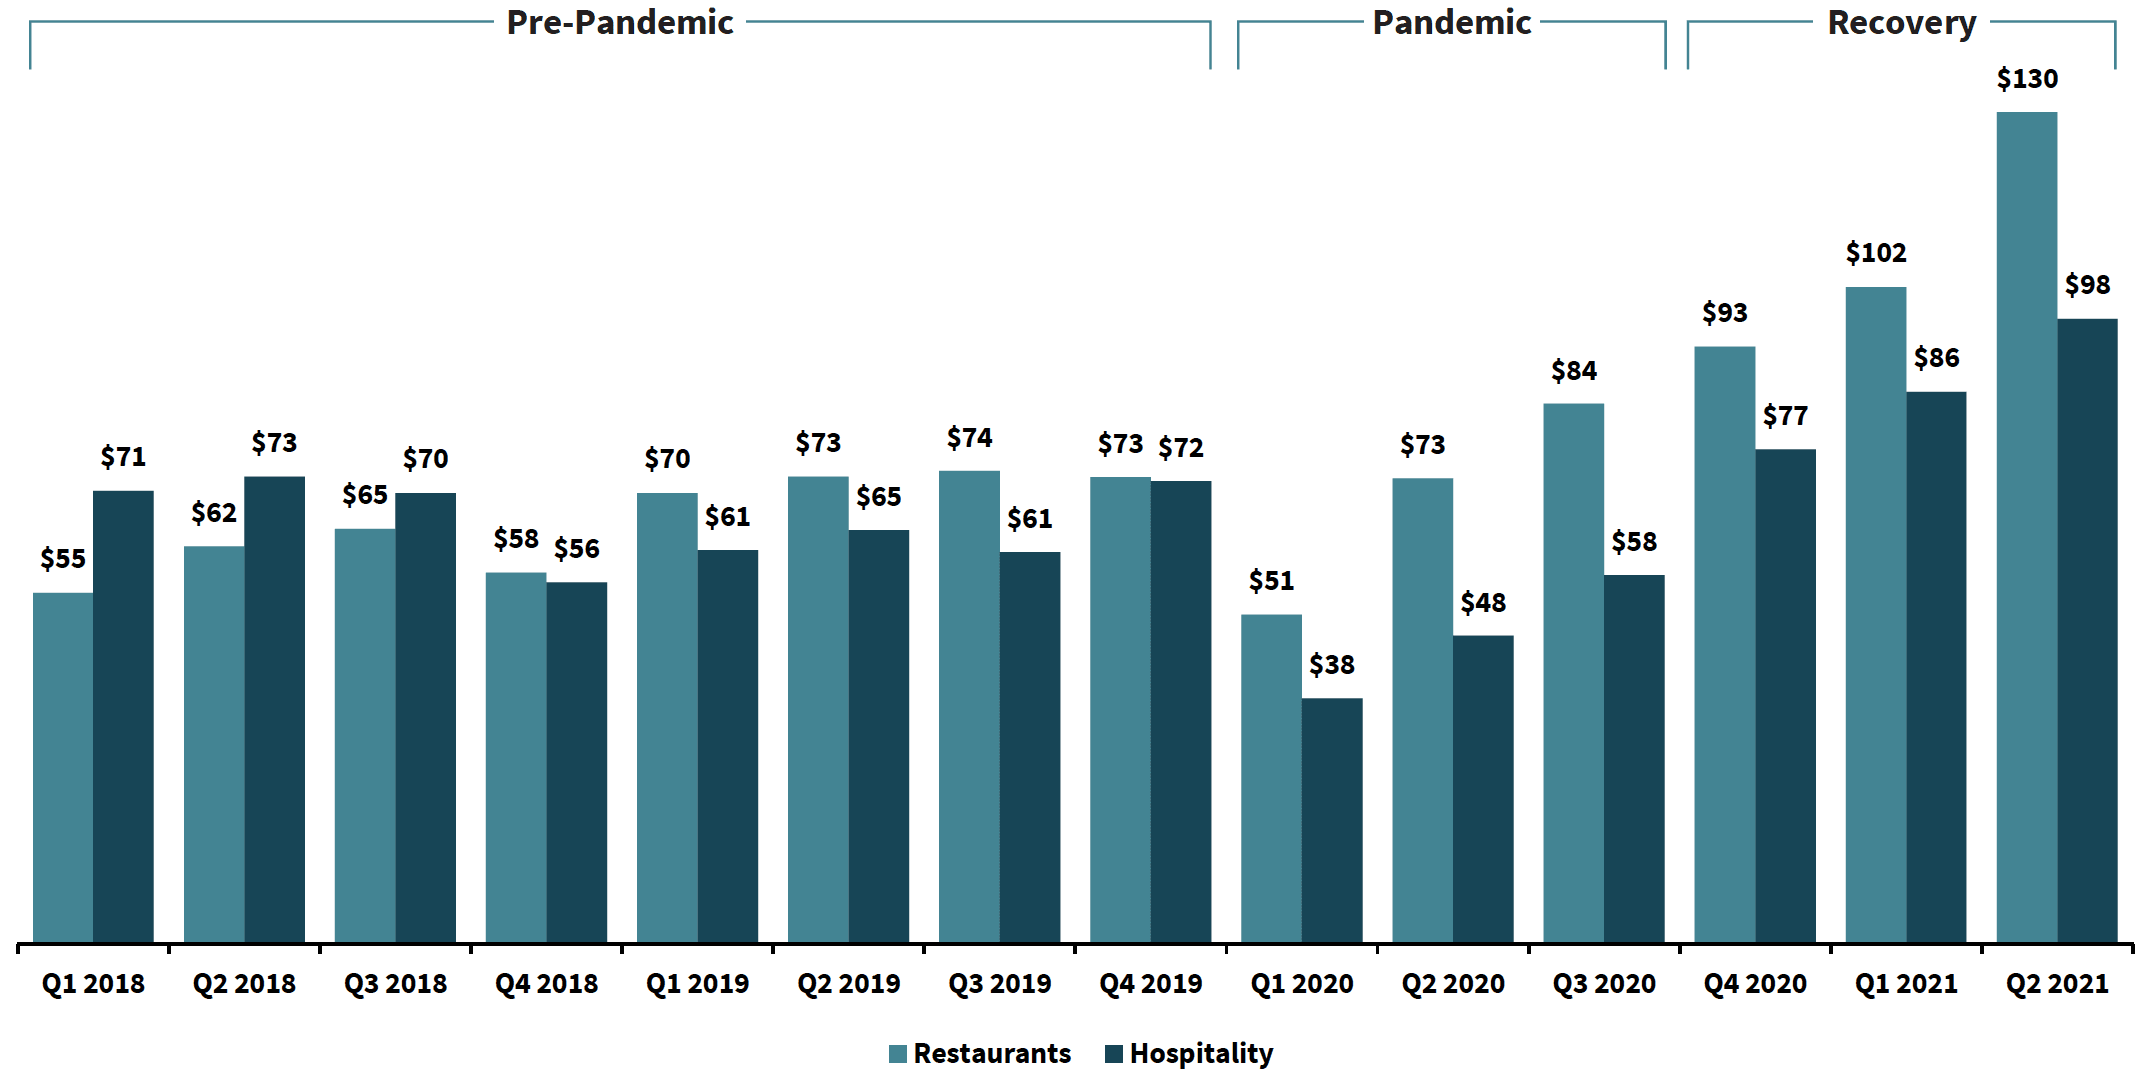
Covid-19 Recovery and Performance
Quarterly Share Price
Covid-19 Recovery Insights and Commentary
Restaurants Struggling to Staff Locations to Keep up With Rising Demand(1)(2)(3)
- Restaurants and bars continue to recover rapidly as COVID-19 restrictions begin to rollback and vaccination levels continue to rise;
- As of the end of May, over 130 million Americans have been fully vaccinated, while over 165 million have at least had their first dose.
- Many top U.S. food service executives believe that a 2022 recovery is optimistic, while a 2024 recovery may be likely if the virus recurs, and restrictions reverse current course.
- In March, restaurants and bars gained 176,000 jobs. Despite unemployment levels, many restaurants and bars are struggling to build out their labor force as uncertainty of restrictions and virus variants loom.
Full Hospitality Sector Recovery Unlikely Until 2024(4)
- Hotel room revenue was cut from $167B in 2019 to $85B as the industry suffered from demand declines as a result of the COVID-19 pandemic. 2020 occupancy rates finished at approximately 44%, down from 66% throughout 2019.
- While the AHLA expects occupancy rates to increase to 52% in 2021 and 61% in 2022, a full recovery inclusive of pre-pandemic levels of business travel is not expected to occur until 2024.
- The second half of 2021 is expected to aid the industry’s recovery as group and business travel begins to resume at reduced levels, complimenting the increase in leisure travel following the vaccine rollout.
Sources: 1 Centers for Disease Control and Prevention; 2 McKinsey Research; 3 Bureau of Labor Statistics; 4 American Hotel and Lodging Association; Meridian Research;5 Q1 2019 – Q1 2021 represent last sale price for each quarter, while Q2 2021 represents the target sale price mean consensus
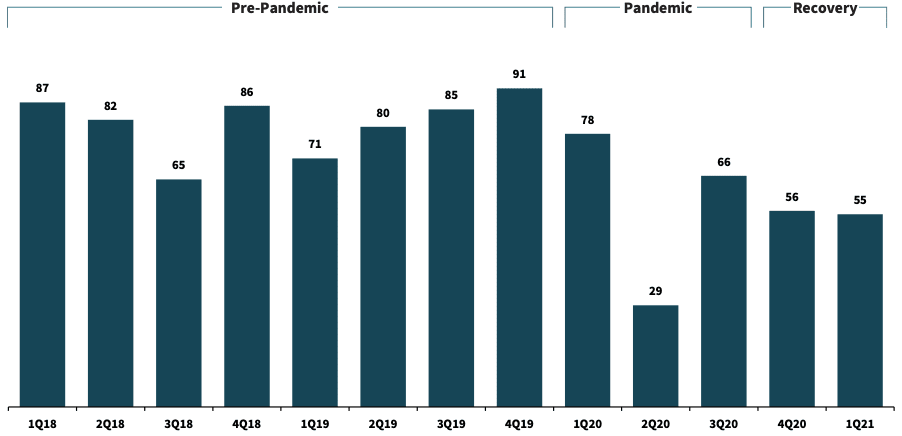
Restaurant and Hospitality M&A Activity
M&A Activity – Total Closed Deals per Quarter
Recent Transaction Spotlights
Description: Kneaders is an operator of a bakery and cafe. The company offers baked artisan bread, sandwiches, homemade pastries, soups and salads.
Rationale: The Company received a significant investment from Garnett Station Partners that will enable it to refinance its existing debt.
Description: Ryman Hospitality operates as REIT specializing in destination hotel assets in urban and resort markets.
Rationale: Ryman is preparing a $210M investment to acquire 35% of Gaylord Rockies Resort & Convention Center, which it does not already own. Ryman sees Gaylord Rockies to be well positioned to be a strong future contributor to its future performance.
Description: Nothing Bundt Cakes is an operator of a bakery chain. The company offers cakes, tiered cakes, bundtlets, bundtlet towers and bundtinis.
Rationale: Roark Capital acquired Nothing Bundt Cakes for an undisclosed amount. The acquisition is Roark’s 29th restaurant investment and 92nd franchise brand.
Select M&A Transactions
Restaurants
| Date | Target | Acquirer/Investor | Brief Description |
|---|---|---|---|
| May-21 | Pokemoto | Muscle Maker Grill | Producer of Hawaiian cuisine in Fairfield, Connecticut. |
| May-21 | Nothing Bundt Cakes | Roark Capital | Operator of a bakery chain based in Addison, Texas. |
| May-21 | Cameron’s Deli | Queensbury Avenue | Operator of a food chain based in New York. |
| May-21 | Aryzta North America | Lindsay Goldberg | Operator of pizza business based in North America. |
| Apr-21 | Hakkasan Group | Tao Group | Operator of a chain of specialty restaurants and nightlife venues based across North America, Europe, Middle East, Asia and Africa. |
| Apr-21 | Duck Donuts | NewSpring Capital | Producer and retailer of donuts via its franchisee stores in the United States. |
| Apr-21 | FARE | Venture Kitchen | A development stage company |
| Apr-21 | Vermont Coffee Company | Stonewall Kitchen | Producer and supplier of bagged organic coffee based in Middlebury, Vermont. |
| Mar-21 | Cici’s Pizza | Gala Capital Partners | Operator of a pizza-buffet chain based across United States. |
| Mar-21 | Freddy’s Frozen Custard & Steakburgers | Thompson Street Capital Partners | Operator of a fast-food restaurant chain created to offer cooked-to-order meals that bring families and loved ones together. |
| Jan-21 | Shipley Do-Nuts | Peak Rock Capital | Operator of a donut and coffeehouse chain across the United States. |
| Jan-21 | Wing Zone | Capriotti’s Sandwich Shop | Operator of the sandwich chain store based in Atlanta, Georgia. |
Hospitality
| Date | Target | Acquirer/Investor | Brief Description |
|---|---|---|---|
| Jun-21 | The Frenchmen Hotel | Angevin & Co. | Operator of a hotel company based in New Orleans, Louisiana. |
| Jun-21 | Edgewater Beach Resort Management | VTrips | Operator of a resort company intended to build lifelong customers by creating lifelong memories. |
| May-21 | Metropolitan Riveters | N/A | Operator of a national hockey team based in New York. |
| May-21 | Niagara Jet Adventures | Crestview Partners | Operator of an adventure tour company based in Youngstown, New York. |
| May-21 | Silver Sands Motel | Thunderbowl Capital | Operator of a motel and beach cottages in Greenport, New York. |
| Apr-21 | Walks | Crestview Partners | Provider of travel tours intended to deliver designed tours in cities across the globe. |
| Apr-21 | Welk Resorts | Marriott Vacations Worldwide | Owner and operator of a vacation resort in San Marcos, California. |
| Mar-21 | Hilo Seaside Hotel | Soul Community Planet | Operator of a hotel intended to provide hospitality and affordable accommodations for the adventure traveler. |
| Mar-21 | Red Lion Hotels | HPT SN Holding | Operator of a chain of hotels based in Denver, Colorado. |
Publicly-Traded Restaurant Companies
Upscale
| Company Name | Ticker | Share Price | 52 Week High – Low | Market Cap | Enterprise Value | Net Debt | TTM Revenue | TTM EBITDA | TTM EBITDA Margin | TTM Revenue | TTM EBITDA |
|---|---|---|---|---|---|---|---|---|---|---|---|
| Ark Restaurants | RUTH | $24.14 | $28.73 – $6.15 | $830 | $1,059 | $229 | $251 | $9 | 3.5% | 4.2x | NM |
| Ruth’s Hospitality Group | STKS | $10.72 | $11.98 – $1.25 | $323 | $458 | $136 | $152 | $2 | 1.2% | 3.0x | NM |
| The One Group | ARKR | $19.94 | $24.66 – $9.26 | $71 | $163 | $92 | $73 | ($3) | (4.4%) | 2.2x | NM |
| Average | $408 | $560 | $152 | $159 | $3 | 1.6% | 3.5x | NM | |||
| Median | $323 | $458 | $136 | $152 | $2 | 1.2% | 3.0x | NM |
Casual & Family Dining
| Company Name | Ticker | Share Price | 52 Week High – Low | Market Cap | Enterprise Value | Net Debt | TTM Revenue | TTM EBITDA | TTM EBITDA Margin | TTM Revenue | TTM EBITDA |
|---|---|---|---|---|---|---|---|---|---|---|---|
| Famous Dave’s Of America | DRI | $143.23 | $149.73 – $68.68 | $18,741 | $22,833 | $4,092 | $6,187 | $83 | 1.3% | 3.7x | NM |
| BJ’s Restaurants | TXRH | $100.71 | $110.75 – $46.84 | $7,024 | $7,384 | $344 | $2,546 | $118 | 4.6% | 2.9x | 62.5x |
| Bloomin’ Brands | CBRL | $157.72 | $178.82 – $96.16 | $3,742 | $4,687 | $945 | $2,532 | $464 | 18.3% | 1.9x | 10.1x |
| Brinker International | EAT | $61.45 | $78.33 – $20.72 | $2,811 | $4,923 | $2,112 | $2,892 | $201 | 6.9% | 1.7x | 24.5x |
| Chuy’s Holdings | CAKE | $58.82 | $65.81 – $19.78 | $2,734 | $4,395 | $1,448 | $1,996 | ($126) | (6.3%) | 2.2x | (34.9x) |
| Cracker Barrel Old Country Store | BLMN | $29.55 | $32.81 – $9.36 | $2,628 | $4,892 | $2,258 | $3,143 | $139 | 4.4% | 1.6x | 35.3x |
| Darden Restaurants | PLAY | $42.28 | $51.73 – $11.23 | $2,020 | $3,919 | $1,899 | $437 | ($117) | (26.8%) | 9.0x | (33.5x) |
| Dave & Buster’s | DIN | $94.95 | $100.70 – $34.31 | $1,629 | $3,248 | $1,619 | $687 | ($3) | (0.5%) | 4.7x | NM |
| Denny’s | BJRI | $55.28 | $63.42 – $16.08 | $1,285 | $1,798 | $513 | $747 | ($8) | (1.1%) | 2.4x | NM |
| DineBrands | DENN | $17.58 | $20.02 – $7.87 | $1,128 | $1,490 | $363 | $272 | $45 | 16.5% | 5.5x | 33.2x |
| J. Alexander’s Holdings | CHUY | $41.45 | $49.99 – $12.55 | $828 | $948 | $120 | $314 | $44 | 14.1% | 3.0x | 21.3x |
| Kura Sushi USA | RRGB | $35.86 | $41.34 – $7.26 | $562 | $1,219 | $657 | $883 | ($102) | (11.6%) | 1.4x | (11.9x) |
| Lubys | KRUS | $42.98 | $43.78 – $10.00 | $362 | $435 | $73 | $27 | ($21) | (78.8%) | 16.2x | (20.6x) |
| Red Robin Gourmet Burgers | JAX | $12.01 | $12.26 – $3.59 | $181 | $267 | $84 | $184 | $4 | 2.4% | 1.5x | 61.3x |
| Texas Roadhouse | BBQ | $13.39 | $16.52 – $2.83 | $125 | $194 | $70 | $134 | ($5) | (3.4%) | 1.4x | (42.8x) |
| Cheesecake Factory | LUB | $3.69 | $3.75 – $.76 | $114 | $178 | $71 | $161 | ($8) | (5.2%) | 1.1x | (21.5x) |
| Average | $2,870 | $3,926 | $1,042 | $1,446 | $44 | 3.1% | 2.7x | NM | |||
| Median | $1,457 | $2,523 | $585 | $717 | $1 | 0.1% | 3.5x | NM |
Fast Casual
| Company Name | Ticker | Share Price | 52 Week High – Low | Market Cap | Enterprise Value | Net Debt | TTM Revenue | TTM EBITDA | TTM EBITDA Margin | TTM Revenue | TTM EBITDA |
|---|---|---|---|---|---|---|---|---|---|---|---|
| Chipotle Mexican Grill | CMG | $1,371.98 | $1579.52 – $964.50 | $38,622 | $40,813 | $2,191 | $6,315 | $815 | 12.9% | 6.5x | 50.1x |
| FAT Brands | WING | $142.68 | $172.87 – $112.47 | $4,243 | $4,674 | $431 | $184 | $58 | 31.5% | 25.5x | 80.8x |
| Fiesta Restaurant Group | SHAK | $93.98 | $138.38 – $47.12 | $3,950 | $4,196 | $220 | $535 | ($2) | (0.3%) | 7.8x | NM |
| Noodles & Company | NDLS | $12.88 | $12.97 – $5.15 | $586 | $852 | $266 | $403 | ($11) | (2.7%) | 2.1x | (77.4x) |
| Potbelly Sandwich Works | FRGI | $13.59 | $18.52 – $5.36 | $360 | $658 | $299 | $553 | $35 | 6.3% | 1.2x | 19.0x |
| Shake Shack | PBPB | $6.89 | $7.74 – $2.00 | $193 | $408 | $215 | $282 | ($64) | (22.6%) | 1.4x | (6.4x) |
| Wingstop Restaurants | FAT | $10.15 | $11.40 – $2.93 | $124 | $242 | $97 | $20 | ($12) | (56.7%) | 12.0x | (21.1x) |
| Average | $6,868 | $7,406 | $531 | $1,185 | $117 | 9.9% | 6.3x | NM | |||
| Median | $586 | $852 | $266 | $403 | ($2) | (0.4%) | 2.1x | NM |
Publicly-Traded Restaurant Companies
Quick-Service
| Company Name | Ticker | Share Price | 52 Week High – Low | Market Cap | Enterprise Value | Net Debt | TTM Revenue | TTM EBITDA | TTM EBITDA Margin | TTM Revenue | TTM EBITDA |
|---|---|---|---|---|---|---|---|---|---|---|---|
| Carrols Corporation | MCD | $233.89 | $238.18 – $178.88 | $174,523 | $221,056 | $46,533 | $19,270 | $9,656 | 50.1% | 11.5x | 22.9x |
| Del Taco | YUM | $119.97 | $122.73 – $84.17 | $35,739 | $45,801 | $10,062 | $5,875 | $2,048 | 34.9% | 7.8x | 22.4x |
| Domino’s Pizza | QSR | $83.29 | $71.10 – $50.69 | $25,568 | $43,458 | $12,541 | $5,003 | $1,396 | 27.9% | 8.7x | 31.1x |
| El Pollo Loco | DPZ | $426.87 | $447.50 – $319.71 | $16,575 | $20,661 | $4,087 | $4,228 | $826 | 19.5% | 4.9x | 25.0x |
| Jack In The Box | WEN | $23.22 | $24.91 – $18.86 | $5,140 | $8,470 | $3,330 | $1,789 | $437 | 24.4% | 4.7x | 19.4x |
| McDonald’s | PZZA | $93.95 | $110.33 – $73.12 | $3,433 | $4,074 | $368 | $1,689 | $174 | 10.3% | 2.4x | 23.4x |
| Papa John’s International | JACK | $113.60 | $124.53 – $66.44 | $2,525 | $4,652 | $2,127 | $1,093 | $328 | 30.0% | 4.3x | 14.2x |
| Restaurant Brands International | LOCO | $16.86 | $21.96 – $13.53 | $615 | $864 | $249 | $429 | $50 | 11.7% | 2.0x | 17.2x |
| The Wendy’s Company | TACO | $10.16 | $11.99 – $5.57 | $373 | $756 | $382 | $498 | $73 | 14.7% | 1.5x | 10.4x |
| Yum! Brands | TAST | $5.91 | $8.09 – $4.01 | $304 | $1,574 | $1,270 | $1,586 | $43 | 2.7% | 1.0x | 36.9x |
| Average | $26,480 | $35,137 | $8,095 | $4,146 | $1,503 | 36.3% | 8.5x | 23.4x | |||
| Median | $4,286 | $6,561 | $2,729 | $1,739 | $383 | 22.0% | 3.8x | 17.1x |
Snacks and Coffee
| Company Name | Ticker | Share Price | 52 Week High – Low | Market Cap | Enterprise Value | Net Debt | TTM Revenue | TTM EBITDA | TTM EBITDA Margin | TTM Revenue | TTM EBITDA |
|---|---|---|---|---|---|---|---|---|---|---|---|
| Starbucks | SBUX | $113.88 | $118.98 – $71.06 | $134,185 | $153,710 | $19,519 | $22,052 | $2,117 | 9.6% | 7.0x | 72.6x |
Publicly-Traded Hospitality Companies
Lodging and Hotels
| Company Name | Ticker | Share Price | 52 Week High – Low | Market Cap | Enterprise Value | Net Debt | TTM Revenue | TTM EBITDA | TTM EBITDA Margin | TTM Revenue | TTM EBITDA |
|---|---|---|---|---|---|---|---|---|---|---|---|
| Hilton Worldwide Holdings | MAR | $143.58 | $159.98 – $80.26 | $46,755 | $57,110 | $10,355 | $1,771 | $338 | 19.1% | 32.2x | NM |
| Hyatt | HLT | $125.27 | $132.69 – $69.83 | $34,892 | $43,419 | $8,524 | $1,231 | ($294) | (23.9%) | 35.3x | NM |
| Marriott International | IHG | $49.21 | $78.34 – $40.91 | $9,016 | $10,922 | $2,590 | $992 | $27 | 2.7% | 11.0x | NM |
| Choice Hotels International | H | $78.08 | $92.22 – $45.62 | $7,947 | $9,954 | $2,004 | $488 | ($740) | (151.6%) | 20.4x | NM |
| InterContinental Hotels Group | WH | $75.06 | $76.49 – $39.70 | $7,011 | $9,072 | $2,061 | $795 | $58 | 7.3% | 11.4x | NM |
| Extended Stay America | CHH | $120.91 | $121.39 – $75.04 | $6,718 | $7,564 | $846 | $725 | $120 | 16.5% | 10.4x | 63.2x |
| Wyndham Hotel Group | STAY | $19.71 | $20.09 – $10.64 | $3,503 | $6,242 | $2,290 | $1,023 | $401 | 39.2% | 6.1x | 15.6x |
| Average | $16,549 | $20,612 | $4,096 | $1,003 | ($13) | (1.3%) | 20.5x | NM | |||
| Median | $7,947 | $9,954 | $2,290 | $992 | $58 | 5.8% | 10.0x | NM |
Resorts & Entertainment
| Company Name | Ticker | Share Price | 52 Week High – Low | Market Cap | Enterprise Value | Net Debt | TTM Revenue | TTM EBITDA | TTM EBITDA Margin | TTM Revenue | TTM EBITDA |
|---|---|---|---|---|---|---|---|---|---|---|---|
| Bally’s | LVS | $57.75 | $66.77 – $42.58 | $44,119 | $56,995 | $12,372 | $3,026 | ($654) | (21.6%) | 18.8x | NM |
| Boyd Gaming | CZR | $107.45 | $109.19 – $29.06 | $22,425 | $47,152 | $24,710 | $4,201 | $539 | 12.8% | 11.2x | NM |
| Caesars Entertainment | MGM | $42.87 | $43.90 – $14.65 | $21,029 | $41,492 | $15,466 | $4,352 | ($982) | (22.6%) | 9.5x | NM |
| Vail Resorts | WYNN | $131.87 | $143.88 – $67.54 | $15,252 | $23,999 | $9,184 | $1,868 | ($419) | (22.5%) | 12.8x | NM |
| Sands | MTN | $326.88 | $338.50 – $172.89 | $13,170 | $15,224 | $1,828 | $1,588 | $416 | 26.2% | 9.6x | 36.6x |
| MGM Resorts International | PENN | $81.97 | $142.00 – $26.96 | $12,817 | $21,963 | $9,122 | $3,738 | $887 | 23.7% | 5.9x | 24.8x |
| Monarch Casino & Resort | BYD | $64.39 | $71.00 – $17.43 | $7,217 | $11,319 | $4,102 | $2,101 | $456 | 21.7% | 5.4x | 24.8x |
| Penn National Gaming | RRR | $44.75 | $45.24 – $9.38 | $5,234 | $8,149 | $2,713 | $1,107 | $249 | 22.5% | 7.4x | 32.7x |
| Red Rock Resorts | BALY | $58.03 | $75.92 – $19.50 | $2,464 | $3,511 | $1,047 | $437 | $6 | 1.3% | 8.0x | NM |
| Wynn Resorts | MCRI | $71.36 | $76.00 – $30.29 | $1,322 | $1,470 | $148 | $198 | $46 | 23.0% | 7.4x | 32.3x |
| Full House Resorts | FLL | $11.26 | $11.92 – $1.23 | $384 | $613 | $229 | $129 | $19 | 14.7% | 4.8x | 32.3x |
| Average | $13,221 | $21,081 | $7,356 | $2,068 | $51 | 2.5% | 10.2x | NM | |||
| Median | $12,817 | $15,224 | $4,102 | $1,868 | $46 | 2.4% | 8.2x | NM |
Meridian Capital Sector Coverage
- Alcoholic & Non-Alcoholic Beverages
- Baked Goods & Snack Foods
- Better-for-you / Natural & Organic
- Branded Food Products
- Foodservice Equipment & Supply
- Ingredients
- Private-Label Manufacturers
- Restaurants
Meridian Capital's Food, Beverage & Agribusiness Transaction Experience


*Note: Includes transactions completed by Meridian bankers while at previous firms

