Engineering, Construction & Building Products M&A Trends: Winter 2021
Published April 20, 2021

- Total construction grows, led by residential construction
- Supply chain disruptions and uncertainty lead to increased costs
- Building products M&A remains active
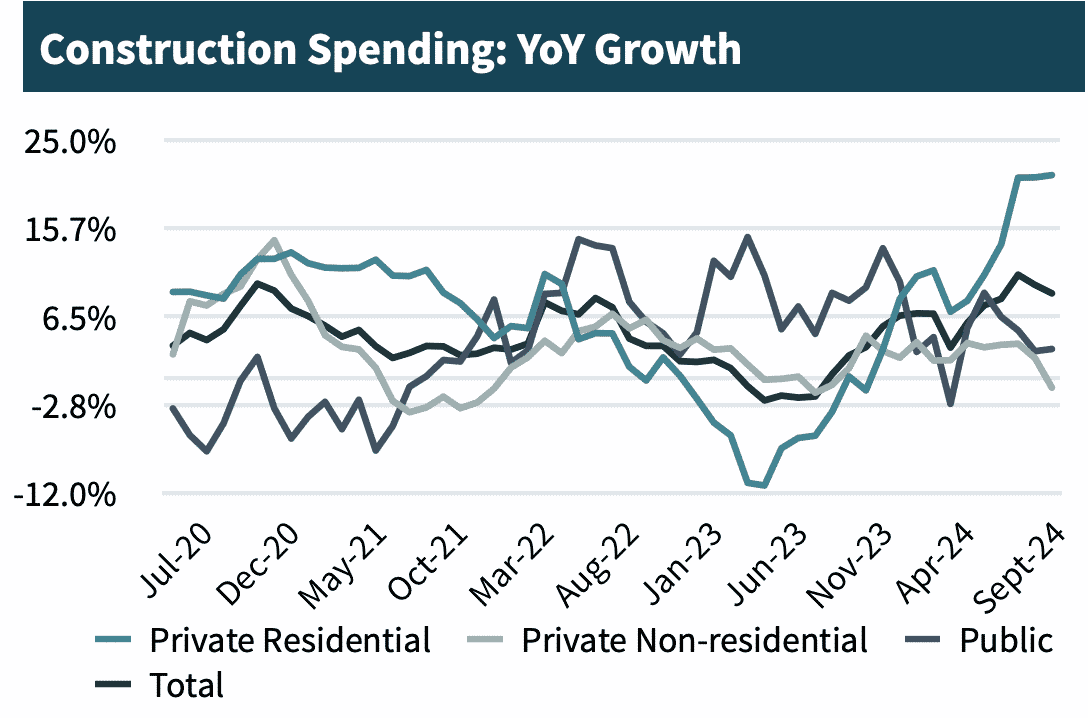
Residential Construction done in the U.S. in 2020 saw Year-over-Year(“YoY”) growth of 20%+ in August, September, and October. While many other construction categories saw growth, Residential Construction is leading the post-COVID recovery with continued optimism heading into 2021.
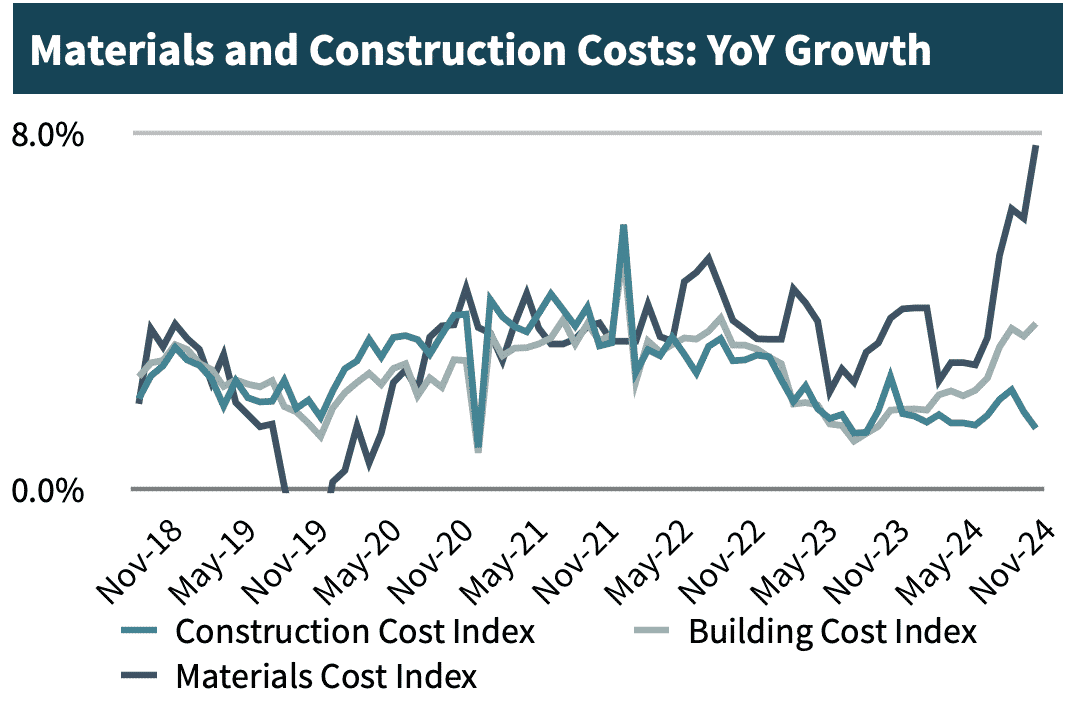
On the supply chain side, Construction Costs, most notably Materials Costs, have increased significantly, ending December up 7.7% YoY. The rise in costs is partly attributable to suppliers cutting production due to COVID-19 safety measures and supply shortages in the lumber market throughout 2020.
While overall M&A activity in the ENC&BP space dropped YoY in 2020, Q4 was a significant quarter for M&A for Companies operating in the Building Products Distribution sector, as three of the industry’s leaders and a Pacific Northwest leader announced acquisitions.
ENC&BP Market Insights
Total Construction Growth Led by Residential Construction
- Residential Construction done in the U.S. in 2020 saw Year-over-Year (“YoY”) growth of 20%+ in August, September, and October. While many other construction categories saw growth, Residential Construction is leading the post-COVID recovery with continued optimism heading into 2021.
- Total value of Public Construction has seen more muted growth, growing 3.1% YoY in October as project timelines and backlogs are pushed out due to the economic uncertainty caused by the COVID-19 pandemic.
Supply Chain Disruptions and Uncertainty Lead to Increased Costs
- Construction Costs, most notably Materials Costs, have increased significantly, ending December up 7.7% YoY. The rise in costs is partly attributable to suppliers cutting production due to COVID-19 safety measures and uncertainty in the lumber market in early spring. A major recession never materialized, and demand increased in the following months causing a supply shortage, particularly in lumber.
- Additional supply chain delays and disruptions have directly impacted work schedules and project timelines resulting in overall increased Building Costs, which are up 3.7% YoY in December. Key drivers of this trend include continued trade uncertainty and new social distancing guidelines for employees.
Building Products M&A Remains Active
- Q4 was a significant quarter for M&A for Companies operating in the Building Products Distribution sector, as three of the industry’s leaders and a Pacific Northwest leader announced acquisitions.
- The Building Products Distribution sector has experienced significant M&A over the past decade, as companies competing in the space sought: (i) economies of scale; (ii) geographic breadth and depth; (iii) end-to-end product suites, and (iv) branded products to control more aspects of the supply chain and capture additional margin benefits.
- In 2020, additional tailwinds included a surge in single family housing starts and remodeling activity in certain markets, has contributed to a favorable M&A environment as Building Products manufacturers and distributors have become increasingly attractive investments.
Source: US Census, Engineering News Record (“ENR”), Association of General Contractors, U.S. Small Business Administration, PitchBook Data, IBISWorld, Company Press Release,, and Meridian Research
ENC&BP Middle Market M&A Activity
M&A Activity and Market Trends

(1) Middle market M&A includes transactions with EV < $1000mm, and transactions with undisclosed EV.
(2) YTD as of December 30, 2020
Source: S&P CapitalIQ, U.S. Small Business Administration, PitchBook Data, Company Press Releases, and Meridian Research
Commentary
- While total M&A activity in the ENC&BP space decreased approximately 31% in 2020 as compared to 2019, activity is expected to rebound in 2021. Several factors are expected to influence M&A activity including: the continued strong performance of the ENC&BP economy, future tax uncertainty with the new Administration in Washington, and a build up of dry powder on investor’s balance sheets caused by the cash preservation strategies adopted by many during the pandemic.
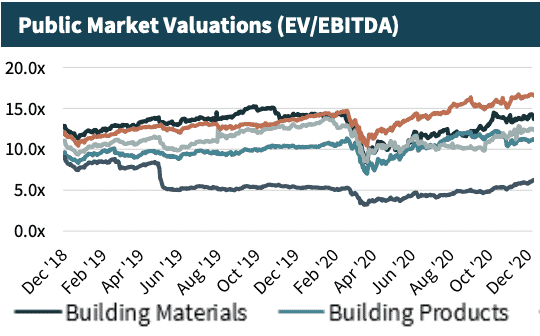
- Though valuations plummeted in early spring due to COVID-19 impacts, the markets quickly recovered and companies in all CEPMB sectors now trade at Enterprise Value / EBITDA (EV/EBITDA) multiples consistent with where they were a year ago. Construction and Building Products valuations have risen with the S&P 500 and now trade at average multiples of 6.3x and 11.6x, respectively, an increase of 17% and 12%, respectively, from where they traded last December. Both Engineering and Building Materials have recovered to December 2019 levels, down 2% and 5% with average multiples of 12.3x and 14.0x, respectively.
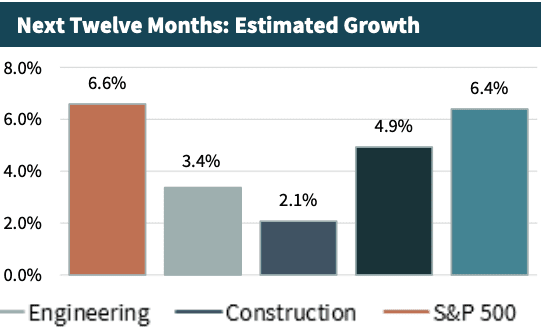
- Over the Next Twelve Months (“NTM”), revenue growth for the S&P 500 is predicted to be 6.6%. This is trailed slightly by Building Products and Building Materials, where sales are expected to grow 6.4% and 4.9%, respectively. NTM sales growth for the Construction sector lags behind with expected growth of 2.1%.
Manor Hardware Acquired by Southerncarlson
Meridian Capital LLC (“Meridian”), a Seattle-based middle market corporate finance and M&A advisory firm is pleased to announce the successful acquisition of one of its clients, Manor Hardware, Inc. (“Manor” or the “Company”) by SouthernCarlson, Inc. (“SouthernCarlson”), a division of Kyocera Corporation.
Founded in 1975, Manor evolved from a general hardware supply store into a full-service construction supply and tool repair operation with multiple locations across Washington State. The Company offers a wide breadth of hardware and construction products tailored to support multi-family, single-family, and commercial construction contractors.
Rob Duncan, President of Manor, shared, “Going through a transaction process can be an incredibly daunting effort when you haven’t done it before. From beginning to end, the Meridian Capital team served as an exceptional partner to us in helping position Manor to the market and navigate the challenges and uncertainties of the deal. They continually kept our priorities and best interests as their own. I’m excited about this next chapter for Manor and the opportunity it provides for our customers and our employees.”
Rob Allen, SouthernCarlson’s head of Corporate Development, commented, “The Pacific Northwest is a strategic focus for us and we look forward to working with Manor’s in-house experts to broaden our guaranteed take-off program for multi-family builders across the country.”
Brian Murphy, President and Managing Director at Meridian stated, “We’re very happy with the outcome for Bob, Rob, and the entire Manor team. Over the past five decades they have built a customer-first business and established a leadership position within the Northwest. The acquisition represents an exciting outcome for Manor and provides SouthernCarlson with an ideal platform for growth in the region.”
Recent Transaction Spotlights
Bain Capital Private Equity to acquire US LBM Holdings, Inc. (“US LBM”)
Announced November 13, 2020
- Bain Capital Private Equity Group (“Bain Capital”) has announced the signing of a definitive agreement to acquire a majority stake in US LBM, a leading distributor of specialty building materials in the United States. Kelso & Company, another private equity firm, has been partnered with US LBM since 2015.
- Founded in 2009 and headquartered in Buffalo Grove, Illinois, US LBM has grown to over 250 locations and 37 divisions, operating under a model that combines the advantages of its national scale and core team of industry experts with a local go-to-market strategy.
- Stephen Thomas, Managing Director at Bain Capital, said that US LBM is poised for continued growth and expansion while “maintaining the company’s unique culture, people-first mindset and commitment to superior customer service.”
- The transaction is expected to close in December 2020.
American Securities LLC to acquire Foundation Building Materials, Inc. (NYSE:FBM)
Announced November 15, 2020
- American Securities LLC (“American Securities”) announced the signing of a definitive agreement to acquire all outstanding shares in Foundation Building Materials, Inc. (“FBM”), one of the largest specialty building products distributors in North America.
- The FBM shares will be acquired for $19.25 per share in an all-cash transaction valued at approximately $1.37 billion. The transaction represents a premium of approximately 27% to the closing price of FBM common stock on the last trading day prior to the announcement, and an Enterprise Value to trailing twelve month EBITDA multiple of 7.3x.
- American Securities was interested in acquiring FBM’s strong national brand and reputation as “the distributor of choice for leading building product suppliers.” FBM will aim to further its global presence alongside their new partner.
- The transaction is expected to close in the first quarter of 2021, subject to customary closing conditions and regulatory approvals.
The Home Depot, Inc. (NYSE:HD) to acquire HD Supply Holdings, Inc. (NYSE:HDS)
Announced November 16, 2020
- The Home Depot, Inc. (“Home Depot”), the world’s largest home improvement retailer, announced it has entered into a definitive agreement to acquire all outstanding shares of HD Supply Holdings, Inc. (“HD Supply”), a leading national distributor of maintenance, repair and operations (“MRO”) products.
- Home depot will acquire the HD supply common stock in an all-cash tender offer for $56 per share, for a total enterprise value of approximately $8 billion. The transaction represents an Enterprise Value to trailing twelve month EBITDA multiple of 11.9x.
- This acquisition is expected to position Home Depot as a premier provider in the highly fragmented $55 billion MRO marketplace. Craig Menear, CEO of Home Depot, cited HD Supply’s robust product offering, valued-added service capabilities, and MRO-specific distribution network in the U.S. and Canada as primary factors in the acquisition.
- The transaction is expected to be completed during the Home Depot’s fiscal fourth quarter, which ends on January 31, 2021, and is subject to customary closing conditions and regulatory approvals.
Source: S&P Capital IQ, Company Press Releases, Meridian Research
Small & Mid-Cap Company Valuations
Construction Firms
| Company Name | Market Cap | Enterprise Value | TTM Sales | TTM EBITDA | TTM Gross Margin | TTM EBITDA Margin | NTM Sales | NTM EBITDA | Est. NTM Sales | Est. NTM EBITDA | Est. NTM EBIT | EV / TTM Sales | EV / TTM EBITDA | EV / NTM Sales | EV / NTM EBITDA | EV / NTM EBIT |
|---|---|---|---|---|---|---|---|---|---|---|---|---|---|---|---|---|
| Quanta Services, Inc. | $9,806 | $11,078 | $11,403 | $896 | 14.4% | 7.9% | 2.4% | 22.6% | $11,678 | $1,098 | $749 | 1.0x | 12.4x | 0.9x | 10.1x | 14.8x |
| EMCOR Group, Inc. | 5,000 | 4,856 | 8,920 | 584 | 15.4% | 6.5% | (1.3%) | (4.1%) | 8,803 | 560 | 454 | 0.5x | 8.3x | 0.6x | 8.7x | 10.7x |
| MasTec, Inc. | 4,922 | 6,192 | 6,393 | 688 | 15.8% | 10.8% | 15.7% | 25.3% | 7,400 | 863 | 532 | 1.0x | 9.0x | 0.8x | 7.2x | 11.6x |
| Comfort Systems USA, Inc. | 1,914 | 2,164 | 2,877 | 245 | 18.9% | 8.5% | (4.7%) | (13.7%) | 2,743 | 211 | 157 | 0.8x | 8.8x | 0.8x | 10.2x | 13.8x |
| Dycom Industries, Inc. | 2,362 | 2,970 | 3,186 | 300 | 17.5% | 9.4% | 1.8% | 11.3% | 3,242 | 333 | 151 | 0.9x | 9.9x | 0.9x | 8.9x | 19.6x |
| Primoris Services Corporation | 1,332 | 1,671 | 3,384 | 240 | 10.7% | 7.1% | 2.4% | 2.0% | 3,465 | 245 | 161 | 0.5x | 7.0x | 0.5x | 6.8x | 10.4x |
| Granite Construction Incorporated | 1,219 | 1,300 | 3,390 | 10 | 5.5% | 0.3% | 2.5% | 2233.0% | 3,474 | 233 | 116 | 0.4x | NM | 0.4x | 5.6x | 11.2x |
| MYR Group Inc. | 986 | 1,061 | 2,210 | 126 | 12.1% | 5.7% | 4.1% | 0.2% | 2,301 | 126 | 81 | 0.5x | 8.4x | 0.5x | 8.4x | 13.1x |
| Great Lakes Dredge & Dock Corporation | 841 | 1,001 | 726 | 149 | 23.8% | 20.5% | 5.1% | 1.2% | 763 | 151 | 107 | 1.4x | 6.7x | 1.3x | 6.6x | 9.4x |
| Sterling Construction Company, Inc. | 527 | 875 | 1,427 | 121 | 12.5% | 8.5% | 0.4% | 5.1% | 1,433 | 128 | 92 | 0.6x | 7.2x | 0.6x | 6.9x | 9.5x |
| Matrix Service Company | 295 | 247 | 946 | 23 | 8.9% | 2.5% | (3.9%) | 51.6% | 908 | 36 | 17 | 0.3x | 10.5x | 0.3x | 7.0x | 14.5x |
| Orion Group Holdings, Inc. | 160 | 245 | 740 | 48 | 11.1% | 6.5% | (3.9%) | (1.3%) | 711 | 48 | 18 | 0.3x | 5.1x | 0.3x | 5.1x | 13.7x |
| Median | $1,486 | $3,032 | $194 | 13.4% | 7.5% | 2.1% | 3.5% | $ 2,992 | $ 222 | $ 134 | 0.6x | 8.4x | 0.6x | 7.1x | 12.4x | |
| Mean | $2,805 | $3,800 | $286 | 13.9% | 7.8% | 1.7% | 194.4% | $ 3,910 | $ 336 | $ 219 | 0.7x | 8.5x | 0.7x | 7.6x | 12.7x |
Engineering Firms
| Company Name | Market Cap | Enterprise Value | TTM Sales | TTM EBITDA | TTM Gross Margin | TTM EBITDA Margin | NTM Sales | NTM EBITDA | Est. NTM Sales | Est. NTM EBITDA | Est. NTM EBIT | EV / TTM Sales | EV / TTM EBITDA | EV / NTM Sales | EV / NTM EBITDA | EV / NTM EBIT |
|---|---|---|---|---|---|---|---|---|---|---|---|---|---|---|---|---|
| Jacobs Engineering Group Inc. | $13,938 | $15,376 | $13,567 | $1,047 | 19.1% | 7.7% | 3.4% | 7.1% | $14,022 | $1,121 | $1,035 | 1.1x | 14.7x | 1.1x | 13.7x | 14.9x |
| Teledyne Technologies Incorporated | 14,196 | 14,669 | 3,111 | 618 | 39.0% | 19.9% | 2.9% | 5.4% | 3,200 | 652 | 529 | 4.7x | 23.7x | 4.6x | 22.5x | 27.7x |
| AECOM | 7,311 | 8,699 | 13,240 | 753 | 5.4% | 5.7% | (0.1%) | NM | 13,229 | 807 | 691 | 0.7x | 11.5x | 0.7x | 10.8x | 12.6x |
| Tetra Tech, Inc. | 6,215 | 6,626 | 2,349 | 268 | 19.0% | 11.4% | 3.5% | 6.0% | 2,430 | 284 | 257 | 2.8x | 24.7x | 2.7x | 23.3x | 25.8x |
| CACI International Inc | 6,281 | 8,241 | 5,816 | 609 | 35.0% | 10.5% | 7.7% | 9.3% | 6,262 | 666 | 534 | 1.4x | 13.5x | 1.3x | 12.4x | 15.4x |
| Stantec Inc. | 3,684 | 4,513 | 2,795 | 332 | 52.7% | 11.9% | 6.1% | 37.1% | 2,965 | 455 | 276 | 1.6x | 13.6x | 1.5x | 9.9x | 16.4x |
| KBR, Inc. | 4,229 | 4,875 | 5,753 | 378 | 11.6% | 6.6% | 2.3% | NM | 5,887 | 520 | 387 | 0.8x | 12.9x | 0.8x | 9.4x | 12.6x |
| Fluor Corporation | 2,215 | 2,001 | 13,452 | (51) | 0.8% | NA | 4.5% | (876.7%) | 14,054 | 396 | 253 | 0.1x | NA | 0.1x | 5.1x | 7.9x |
| Tutor Perini Corporation | 664 | 1,363 | 5,147 | 323 | 8.9% | 6.3% | 3.4% | 14.1% | 5,321 | 368 | 280 | 0.3x | 4.2x | 0.3x | 3.7x | 4.9x |
| VSE Corporation | 436 | 712 | 707 | 83 | 11.2% | 11.7% | (6.8%) | (4.3%) | 659 | 79 | 53 | 1.0x | 8.6x | 1.1x | 9.0x | 13.6x |
| Perma-Fix Environmental Services, Inc. | 72 | 76 | 99 | 6 | 17.5% | 6.0% | NA | NA | 0 | 0 | 0 | 0.8x | 12.9x | NA | NA | NA |
| Median | $4,875 | $5,147 | $323 | 17.5% | 8.5% | 3.4% | 7.6% | $5,321 | $396 | $276 | 1.0x | 12.9x | 1.1x | 9.6x | 14.2x | |
| Mean | $6,105 | $6,003 | $300 | 20.0% | 8.7% | 2.7% | (135.8%) | $5,645 | $397 | $303 | 1.4x | 12.8x | 1.4x | 10.4x | 15.2x |
Building Products
| Company Name | Market Cap | Enterprise Value | TTM Sales | TTM EBITDA | TTM Gross Margin | TTM EBITDA Margin | NTM Sales | NTM EBITDA | Est. NTM Sales | Est. NTM EBITDA | Est. NTM EBIT | EV / TTM Sales | EV / TTM EBITDA | EV / NTM Sales | EV / NTM EBITDA | EV / NTM EBIT |
|---|---|---|---|---|---|---|---|---|---|---|---|---|---|---|---|---|
| Company Name | Market Cap | Enterprise Value | Sales | EBITDA | Gross Margin | EBITDA Margin | Sales | EBITDA | NTM Sales | NTM EBITDA | NTM EBIT | TTM Sales | TTM EBITDA | NTM Sales | NTM EBITDA | NTM EBIT |
| Masco Corporation | $14,236 | $16,045 | $6,967 | $1,375 | 35.8% | 19.7% | 5.5% | 6.5% | $ 7,353 | $ 1,465 | $ 1,325 | 2.3x | 11.7x | 2.2x | 11.0x | 12.1x |
| Trex Company, Inc. | 9,587 | 9,605 | 817 | 237 | 41.4% | 29.0% | 20.2% | 22.2% | 982 | 290 | 265 | NM | 40.5x | 9.8x | 33.1x | 36.3x |
| Owens Corning | 8,224 | 10,868 | 6,822 | 1,242 | 22.4% | 18.2% | 6.4% | 13.8% | 7,258 | 1,414 | 941 | 1.6x | 8.8x | 1.5x | 7.7x | 11.6x |
| Simpson Manufacturing Co., Inc. | 3,995 | 3,801 | 1,237 | 283 | 45.5% | 22.9% | 5.2% | 1.9% | 1,300 | 288 | 247 | 3.1x | 13.4x | 2.9x | 13.2x | 15.4x |
| Builders FirstSource, Inc. | 4,895 | 6,442 | 7,792 | 521 | 26.1% | 6.7% | 17.2% | 39.0% | 9,130 | 724 | 591 | 0.8x | 12.4x | 0.7x | 8.9x | 10.9x |
| UFP Industries, Inc. | 3,415 | 3,456 | 4,758 | 381 | 16.2% | 8.0% | 1.4% | (0.7%) | 4,825 | 379 | 306 | 0.7x | 9.1x | 0.7x | 9.1x | 11.3x |
| Armstrong World Industries, Inc. | 3,571 | 4,185 | 945 | 285 | 35.9% | 30.1% | 1.5% | 17.0% | 959 | 333 | 255 | 4.4x | 14.7x | 4.4x | 12.6x | 16.4x |
| Gibraltar Industries, Inc. | 2,321 | 2,165 | 1,123 | 145 | 25.0% | 12.9% | 10.4% | 21.6% | 1,240 | 176 | 150 | 1.9x | 15.0x | 1.7x | 12.3x | 14.5x |
| Quanex Building Products Corporation | 728 | 846 | 852 | 103 | 22.6% | 12.1% | 6.6% | 7.9% | 908 | 112 | 66 | 1.0x | 8.2x | 0.9x | 7.6x | 12.9x |
| Median | $4,185 | $1,237 | $285 | 26.1% | 18.2% | 6.4% | 13.8% | $1,300 | $333 | $265 | 1.8x | 12.4x | 1.7x | 11.0x | 12.9x | |
| Mean | $6,379 | $3,479 | $508 | 30.1% | 17.7% | 8.3% | 14.4% | $3,773 | $576 | $460 | 2.0x | 14.8x | 2.8x | 12.8x | 15.7x |
Building Materials
| Company Name | Market Cap | Enterprise Value | TTM Sales | TTM EBITDA | TTM Gross Margin | TTM EBITDA Margin | NTM Sales | NTM EBITDA | Est. NTM Sales | Est. NTM EBITDA | Est. NTM EBIT | EV / TTM Sales | EV / TTM EBITDA | EV / NTM Sales | EV / NTM EBITDA | EV / NTM EBIT |
|---|---|---|---|---|---|---|---|---|---|---|---|---|---|---|---|---|
| Vulcan Materials Company | $18,919 | $21,565 | $4,868 | $1,285 | 26.1% | 26.4% | (0.5%) | 1.7% | $4,841 | $1,306 | $904 | 4.4x | 16.8x | 4.5x | 16.5x | 23.9x |
| Martin Marietta Materials, Inc. | 17,068 | 20,053 | 4,346 | 1,276 | 27.4% | 29.4% | 7.4% | 2.0% | 4,666 | 1,301 | 918 | 4.6x | 15.7x | 4.3x | 15.4x | 21.8x |
| Boral Limited | 4,652 | 6,630 | 3,916 | 431 | 30.1% | 11.0% | 8.7% | 59.1% | 4,255 | 686 | 318 | 1.7x | 15.4x | 1.6x | 9.7x | 20.9x |
| Eagle Materials Inc. | 4,168 | 5,264 | 1,570 | 462 | 23.5% | 29.4% | 2.5% | 16.1% | 1,609 | 536 | 392 | 3.4x | 11.4x | 3.3x | 9.8x | 13.4x |
| United States Lime & Minerals, Inc. | 640 | 571 | 158 | 51 | 40.2% | 32.5% | NA | NA | – | – | – | 3.6x | 11.1x | NA | NA | NA |
| Median | $6,630 | $3,916 | $462 | 27.4% | 29.4% | 4.9% | 9.0% | $4,255 | $686 | $392 | 3.6x | 15.4x | 3.8x | 12.6x | 21.4x | |
| Mean | $10,817 | $2,971 | $701 | 29.5% | 25.7% | 4.5% | 19.7% | $3,074 | $766 | $506 | 3.5x | 14.1x | 3.4x | 12.9x | 20.0x |
As of December 30, 2020
Note: Mid-cap defined as market capitalization between $2 billion and $20 billion. Not meaningful (NM) if EV/Sales or EV/EBIT is a significant outlier. NA if denominator is 0 or not available. NTM figures are based on the median estimate of Wall Street analysts
Source: S&P Capital IQ, Company Press Releases, Meridian Research
Select ENC&BP M&A Transactions
| Announced Date | Acquirer/Investor | Target | Target Description |
|---|---|---|---|
| 12/23/20 | Vortex Companies, LLC | North American Pipeline Services LLC | Offers commercial and residential sewer and pipeline services. |
| 12/21/20 | Trinity Hunt Partners, L.P. | Dayspring Restoration | Provides disaster restoration, mitigation, and renovation services. |
| 12/21/20 | Lindsay Goldberg LLC | Pike Corporation | Provides construction and engineering services for electrical utilities. |
| 12/18/20 | Construction Partners, Inc. | R.P.C. Contracting, Inc. | Operates as an excavation, grading, and paving contractor. |
| 12/14/20 | Trachte Building Systems, Inc. | Roof Mart, LLC | Designs and manufactures steel roofing systems, wall panels, trims and trusses for post frame building packages. |
| 12/7/20 | Terracon Consultants, Inc. | TAM Consultants, Inc. | Provides engineering and design services. |
| 12/7/20 | Installed Building Products, Inc. | Custom Glass & Doors, Inc. | Provides glass, shower, shelving, and mirror installation services. |
| 12/7/20 | Squan Construction Services, LLC | ElecComm Corporation | Provides underground and overhead high/low voltage electric and communications line construction services. |
| 12/4/20 | Construction Partners, Inc. | Gelder & Associates, Inc. | An asphalt and paving contractor, manufactures and pours virgin and recycled asphalt mixes. |
| 12/2/20 | AWP, Inc. | Advantage Barricade & RoadMarks, LLC | Engages in installing road signs. |
| 12/2/20 | Tundraland Home Improvements | Renewal by Andersen Corporation | Designs and custom manufactures, and installs windows and patio doors. |
| 11/30/20 | Asgard Partners & Co. | Angstrom Technology, Ltd. | Engages in the designing and building of modular cleanrooms. |
| 11/30/20 | BOXX Modular Inc. | Vanguard Modular Building Systems, LLC | Engages in the planning, design, construction, and installation of prefabricated, portable, and relocatable buildings. |
| 11/30/20 | Layton Construction Co Of Arizona Inc | J.R. Abbott Construction Inc. | Operates as a general contractor. |
| 11/24/20 | Kyocera Industrial Tools, Inc. | Manor Hardware, Inc. | Distributes construction tools. |
| 11/24/20 | ATI Restoration, LLC | Mark 1 Restoration Service, Inc. | Offers fire, water, mold, and storm restoration services; and inspection and appraisal of damages services. |
| 11/19/20 | Renovation Brands LLC | Profile Designs, Inc. | Manufactures tin panels that are used by interior designers and architects to design ceilings. |
| 11/17/20 | OMERS Private Equity | Turnpoint Services, LLC | Provides plumbing, heating, ventilation and air conditioning, electrical, and maintenance and repair services. |
| 11/16/20 | Installed Building Products, Inc. | WeatherSeal Insulation Company, LLC | Offers fiberglass and spray foam insulation services to contractors and homeowners. |
| 11/15/20 | The Home Depot, Inc. | HD Supply Holdings, Inc. | Operates as an industrial distributor in North America. |
| 11/14/20 | American Securities LLC | Foundation Building Materials, Inc. | Distributes building products in the United States and Canada. |
| 11/13/20 | Bain Capital Private Equity, LP | US LBM Holdings, Inc. | Distributes specialty building materials in the United States. |
Meridian Capital Sector Coverage
- Building Materials
- Building Products
- Construction
- Engineering
- Heavy Construction
- Infrastructure
- Specialty Contractors
- Service & Maintenance
- Utilities
