Diversified Industrials M&A Update: Fall 2018
Published November 27, 2018
Key Trends in Diversified Industrials
With over two decades of experience in complex corporate finance and M&A challenges, Meridian Capital serves as a trusted advisor to leading middle market companies. We have over $6B in transaction experience, which offers us deep industry insight and a holistic industry coverage. Our seasoned professionals focus on businesses with $20M to $400M+ in enterprise value. Twice a year, Meridian Capital publishes its Diversified Industrials M&A Update, which focuses on key M&A trends in industrial distribution and manufacturing sectors. The Fall 2018 edition focuses on activity within value-add and specialty distribution sectors.
M&A Trends, Activity, and Public Comps
Meridian’s Diversified Industrial Practice
- Niche Manufacturing
- Industrial Services
- Building Products
- Specialty Distribution
Speciality Distribution Select Subsectors
- Automotive Aftermarket
- Branded Wholesale
- Building Materials
- Food & Foodservice Distribution
- Industrial and Safety Distribution
- Medical and Dental Distribution
- Power and Electrical Distribution
- Transportation and Logistics
Sustained Macroeconomic Momentum in U.S. Industrial Markets Encouraging M&A Activity
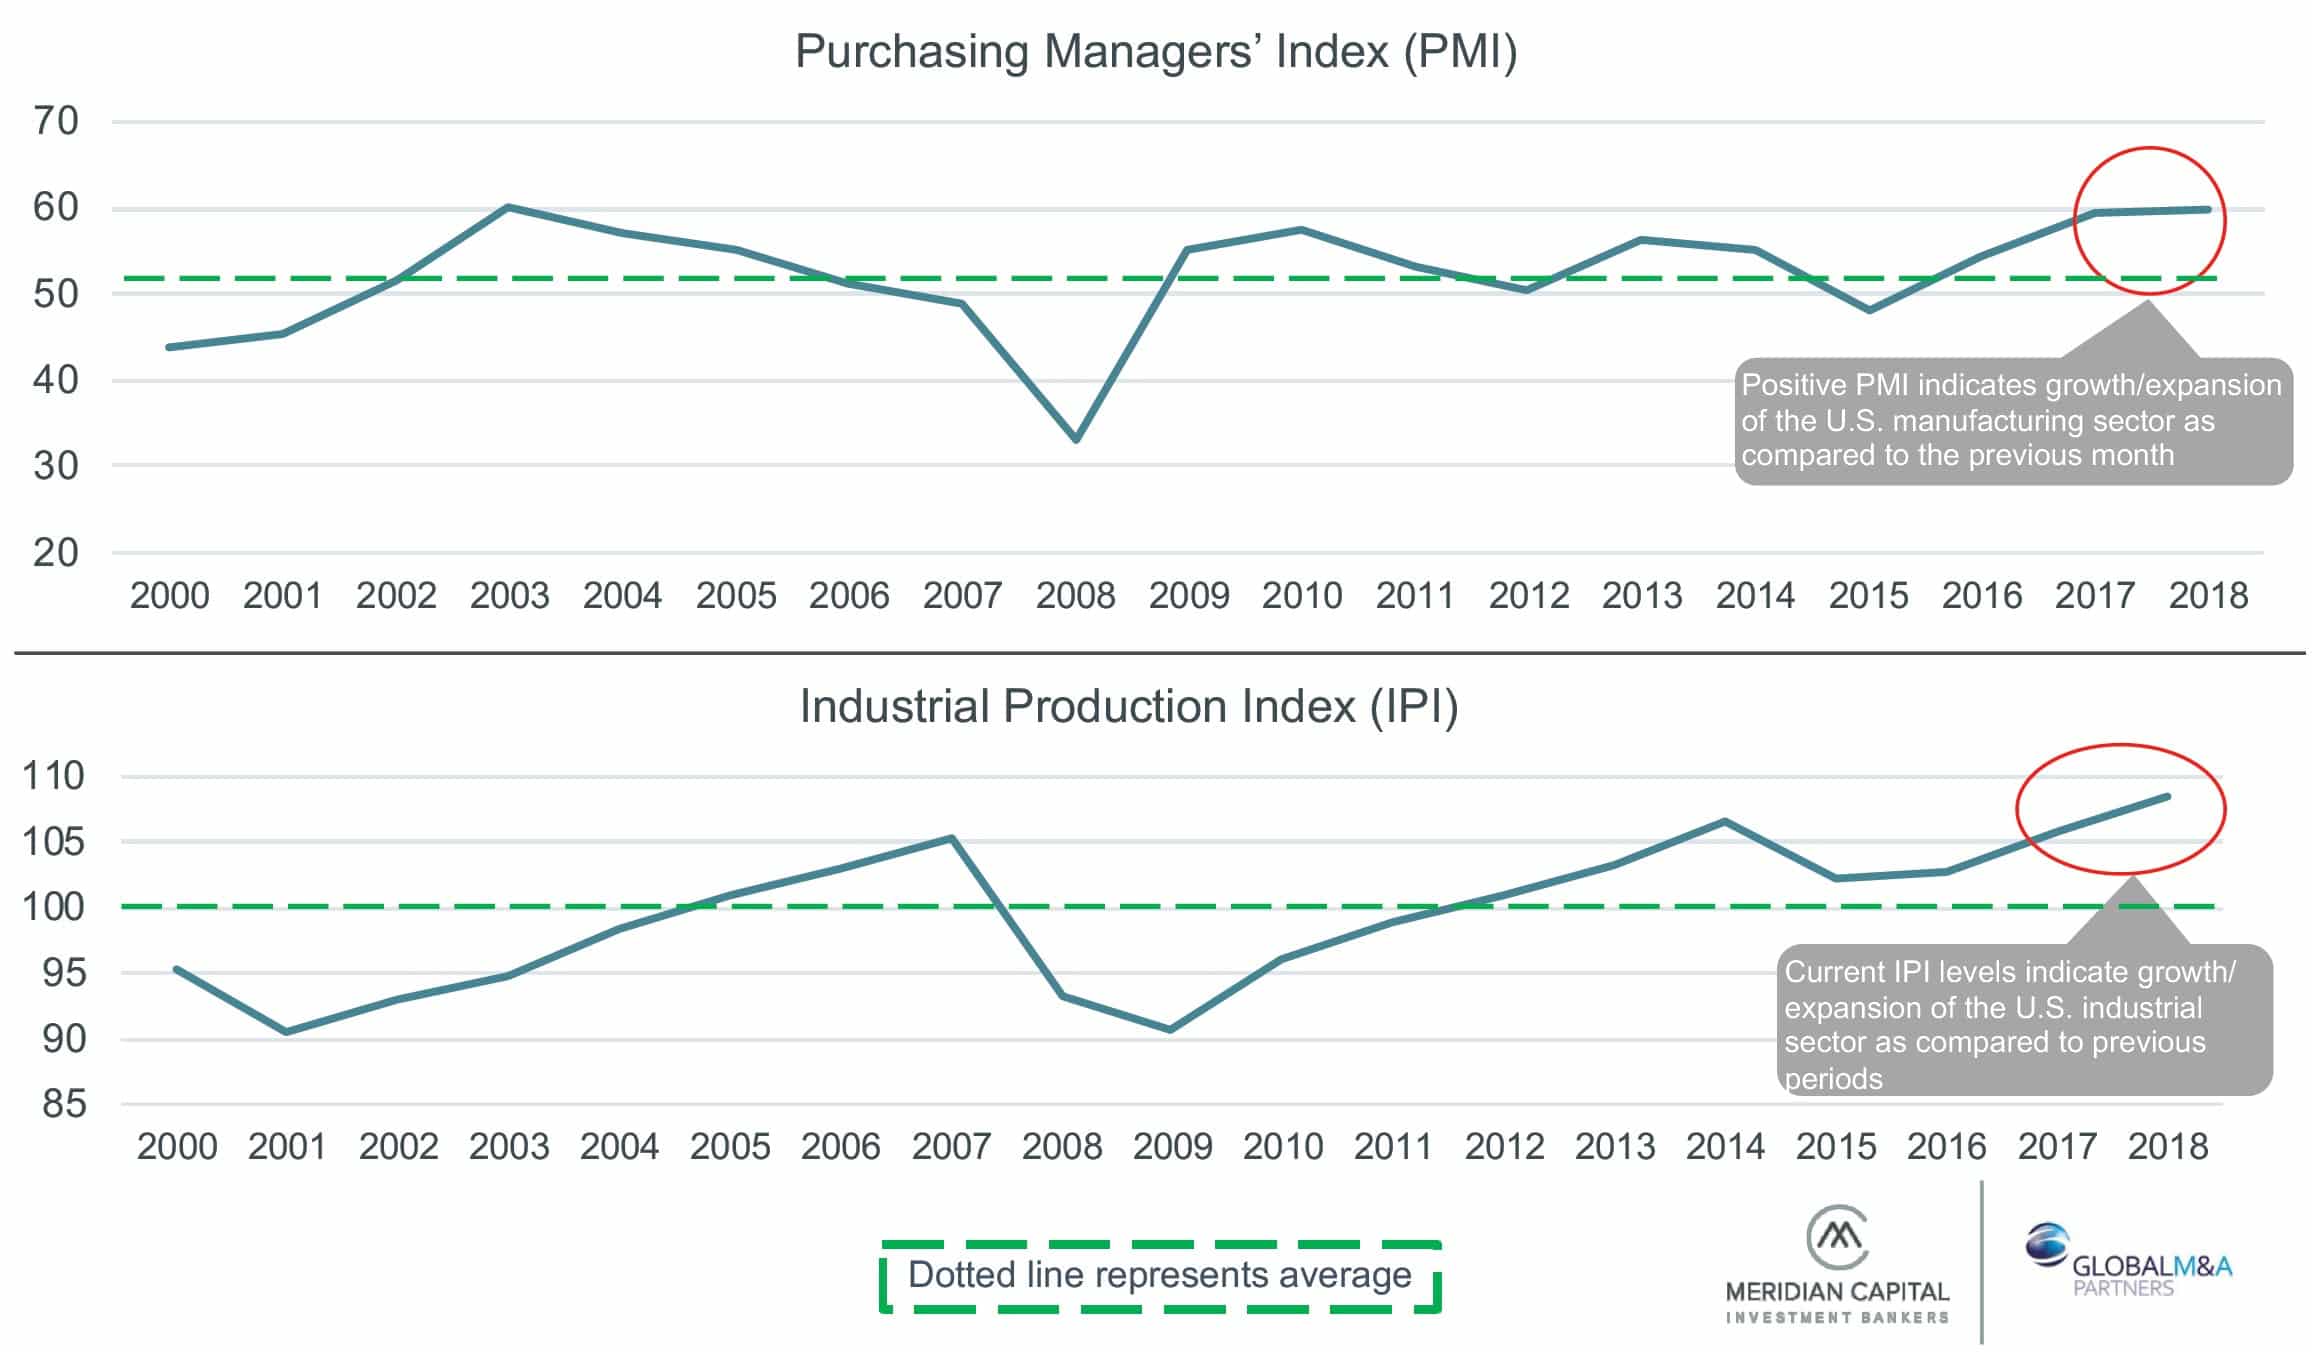
Macroeconomic indicators and key growth indexes continue to reflect positive market momentum. Strong purchasing manager confidence and industrial production output reflect a peak in industrial market confidence. Growth in durable goods orders continues to outpace shipments supporting continued economic expansion in the near term.
Attractive Capital Markets Continue to Bolster the M&A Market
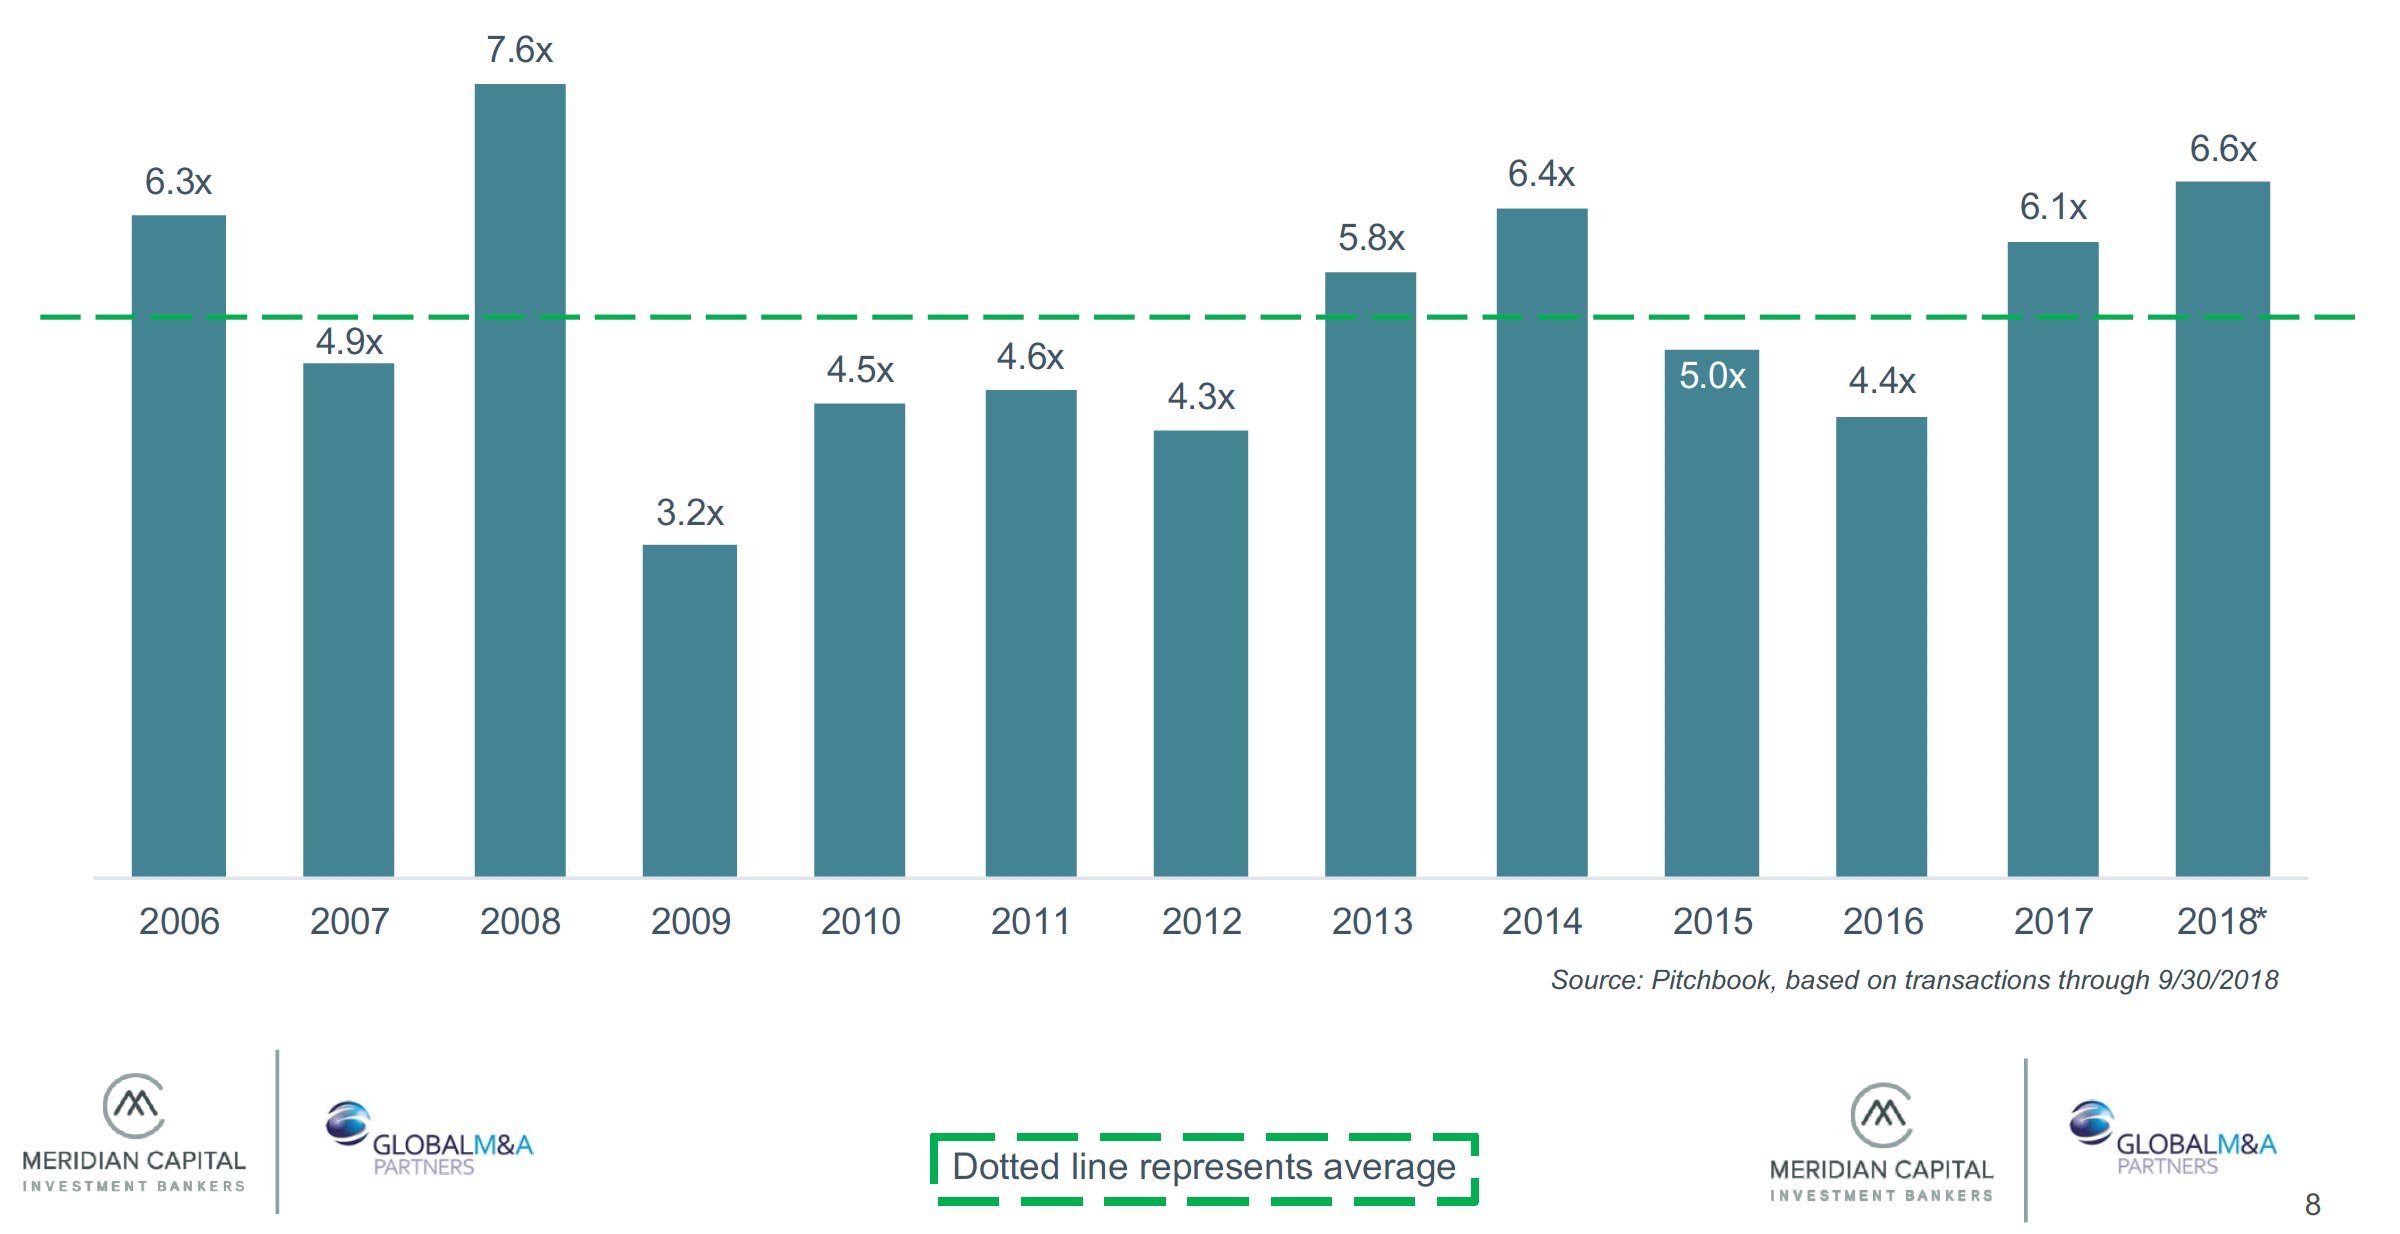
Competitive senior debt markets have resulted in flexible terms and a consistent five-year trend of increasing leverage levels buoying enterprise valuations in industrial market segments like distribution. In early 2018, the market has started to show slight signs of softening as interest rates increase, although leverage levels remain substantially higher than historical averages.
Debt / EBITDA Middle Market Transaction Multiples Trend (All LBOs)
Distribution M&A Trends
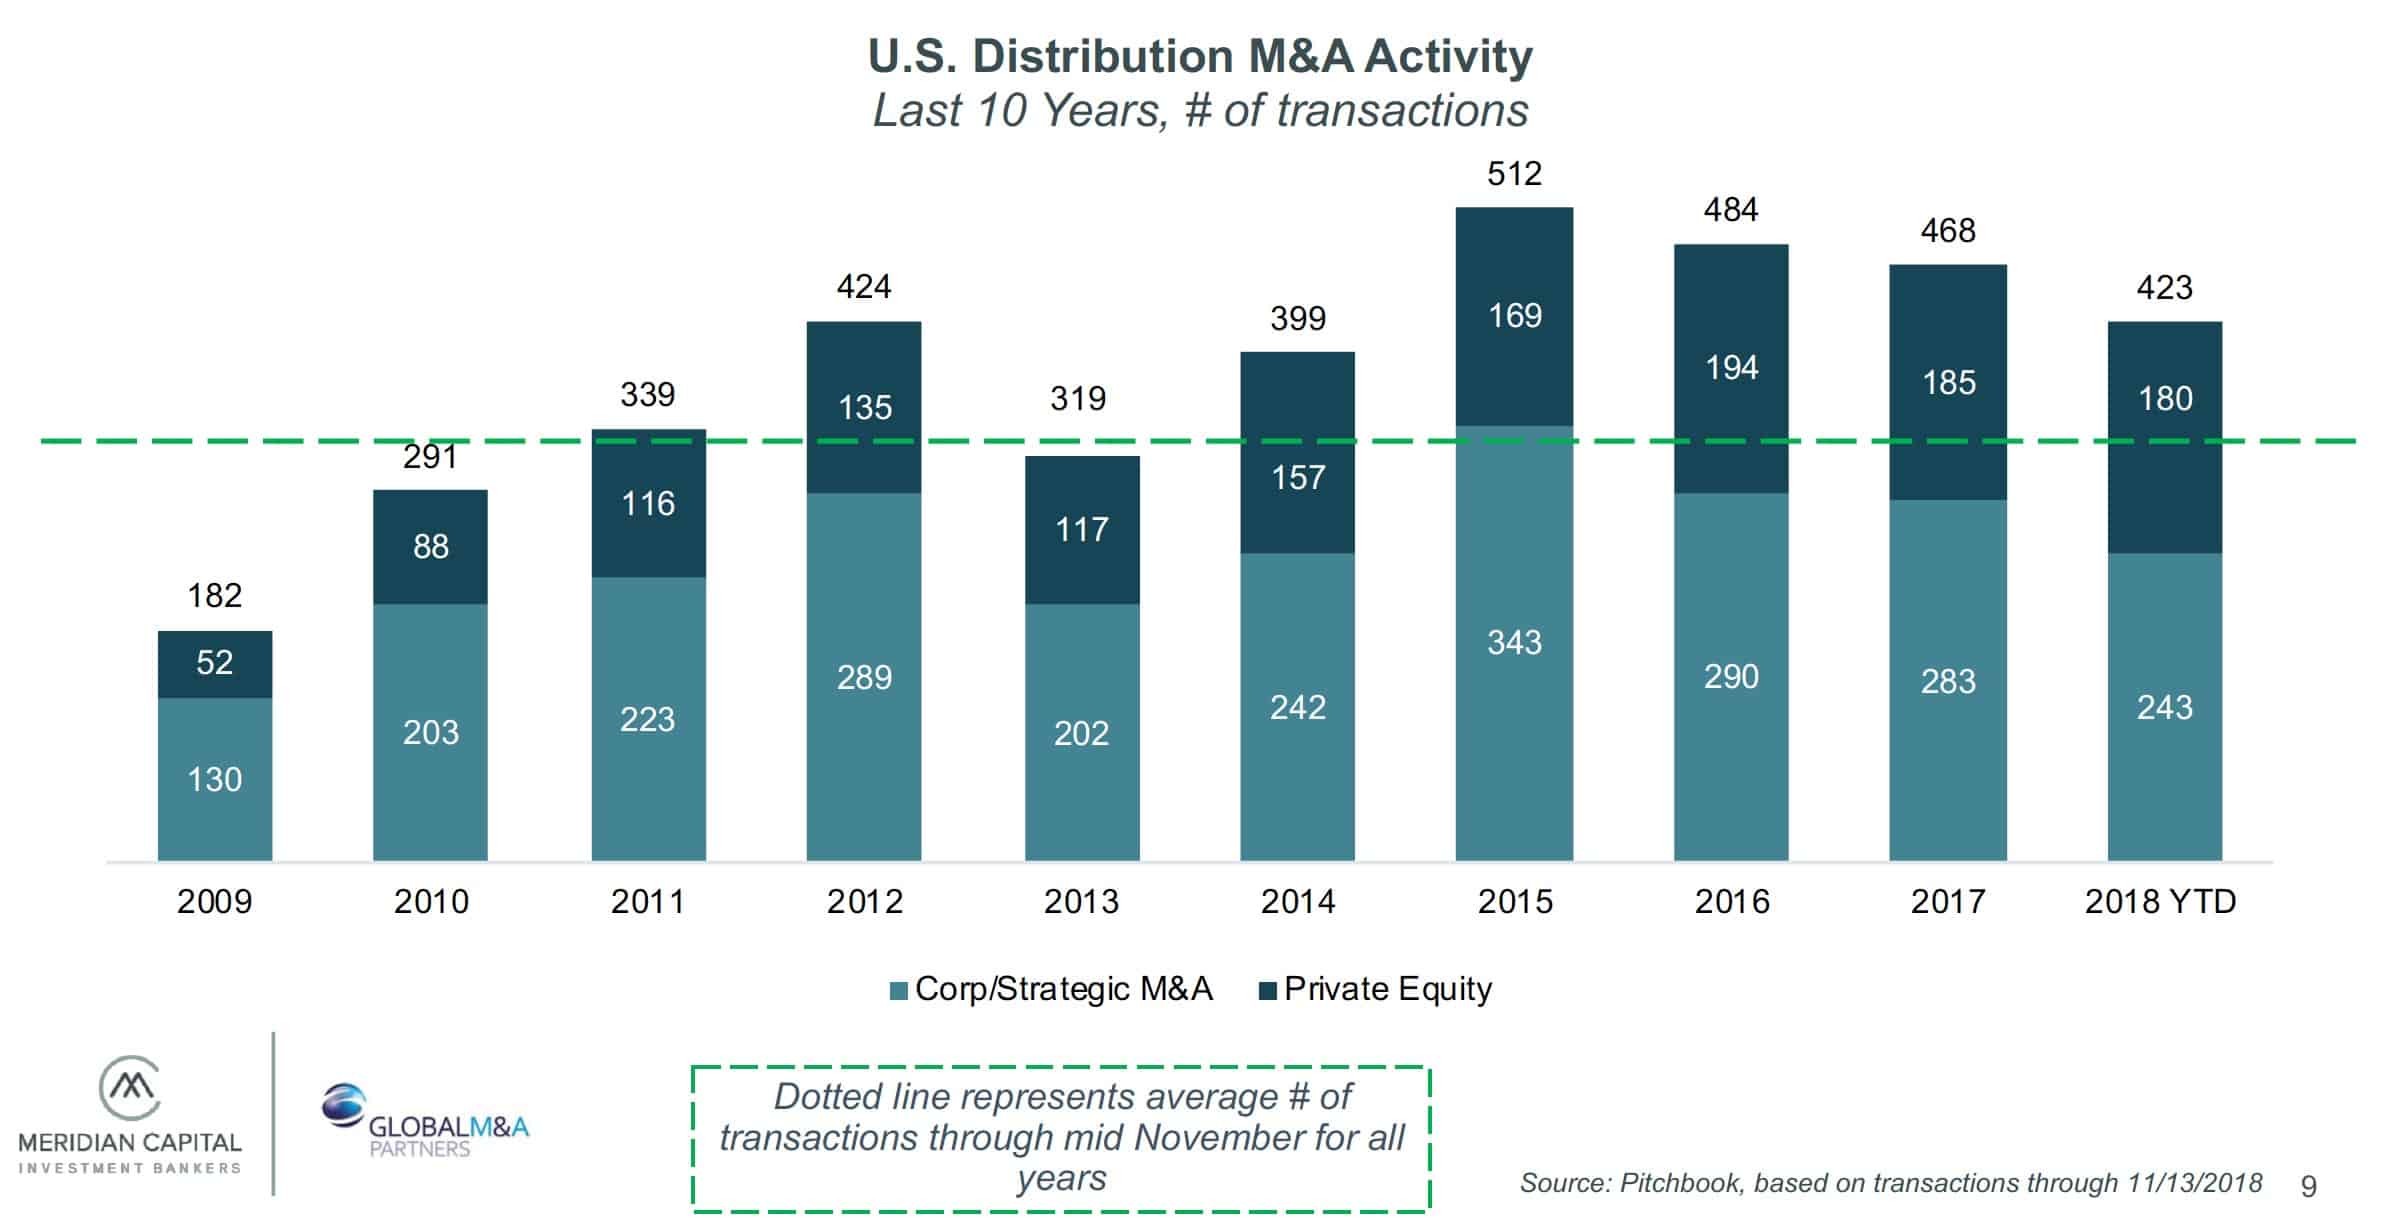
A positive economic outlook and strong capital markets drove robust distribution M&A activity in 2018. Total deal value through mid November has exceeded $31 billion across more than 423 transactions. 2018 transaction volume represents a 2% increase over the same period in 2017 and more than 25% above the trailing 10-year average.
The Amazon Effect
- Amazon continues to pose a significant risk to distributors in B2B distribution markets. The online retail giant has set the market expectation for greater on-demand delivery and pricing transparency causing distributors to adjust their pricing strategies to be more competitive on off-the-shelf items. These shifts are impacting distributors’ gross margins, leading many businesses to seek growth through geographic or channel expansion in order to increase scale and combat margin compression. These market factors have created an active environment for M&A as distributors utilize acquisitions to enter new markets and expand market share.
- While Amazon has made strides in select B2B distribution markets, the company has faced challenges penetrating industrial OEM and MRO markets. One of the greatest barriers to entry in these markets is the rigorous OEM requirements for purchases of mission-critical machinery, components, or supplies that are technical or complex and require unique value-added services and customization.
- The higher the levels of service and customization, the more insulated a distribution sector will be from the impacts of the Amazon effect. Distributors are actively diversifying to combat this by developing dominant positions in niche end-markets, enhancing technical expertise and high-touch services, offering vendor-managed inventory, shifting customer conversations toward total cost of ownership, and ultimately participating in strategic M&A to build incremental differentiating capabilities.
Automation and Technology Adoption
- Technology can be a source of significant competitive advantage for specialty distributors seeking to scale operations and improve margins. Recently the industry has experienced a rising trend toward implementing warehouse management software systems to increase fulfillment efficiency and drive speed through distribution networks. In response to rising labor costs, some distributors are investing in robotic systems, self-driving lifts, and other forms of automation. Distributors are also building ecommerce offerings to supplement their core businesses.
- Distributors with robust technology platforms can realize significant value through integrating smaller businesses onto their platforms. Some distributors are driving technology improvement by acquiring other companies that are further along on the technology adoption curve in order to leverage in-house technology expertise.
- As an example of this, in March 2018, Ficodis Group, a Quebec-based industrial supply distributor, acquired cutting tool supplier, Elite Tools. Through this acquisition, Ficodis is seeking to leverage Elite Tools’ strong online sales expertise and platform to improve its own ecommerce operations.
Active Consolidators Driving Premium Valuations
- The continued availability of debt and equity capital has fueled active consolidation in a number of distribution sectors. In actively consolidating sectors, premium valuations are available for mature companies that represent attractive platforms for consolidation as well as for potential add-on acquisition targets with unique niches or leadership positions in key geographic markets. In sectors with multiple acquisitive players, premium values often come as a result of competitive bidding environments. These environments have, in some cases, yielded values above and beyond what may have been expected based on gross margin profile.
- The foodservice equipment and supplies (FE&S) industry represents a later stage consolidation environment in which the largest participants remain highly acquisitive backed by healthy balance sheets and well-funded private equity funds. The largest company in the sub-sector, Trimark, changed ownership last year when Warburg Pincus sold its position to Centerbridge Partners for a double digit, premium EBITDA multiple. Private equity investors continue to view Trimark as an attractive platform for incremental market consolidation driving this premium valuation.
- In another example of a consolidating market, M&A activity within the janitorial, cleaning, and paper product distribution sector has recently been accelerated by increased interest from several roll-up private equity groups, most notably Audax Private Equity. Since acquiring Imperial Dade in late 2016, Audax has made seven add-on acquisitions (four in 2018).
Expansion of National and International Footprints
- Increasing pressure from online competition, expensive long-distance freight costs, and a need to obtain market share in growing geographies has continued to motivate many distributors to expand their geographic footprints through M&A, both nationally and internationally.
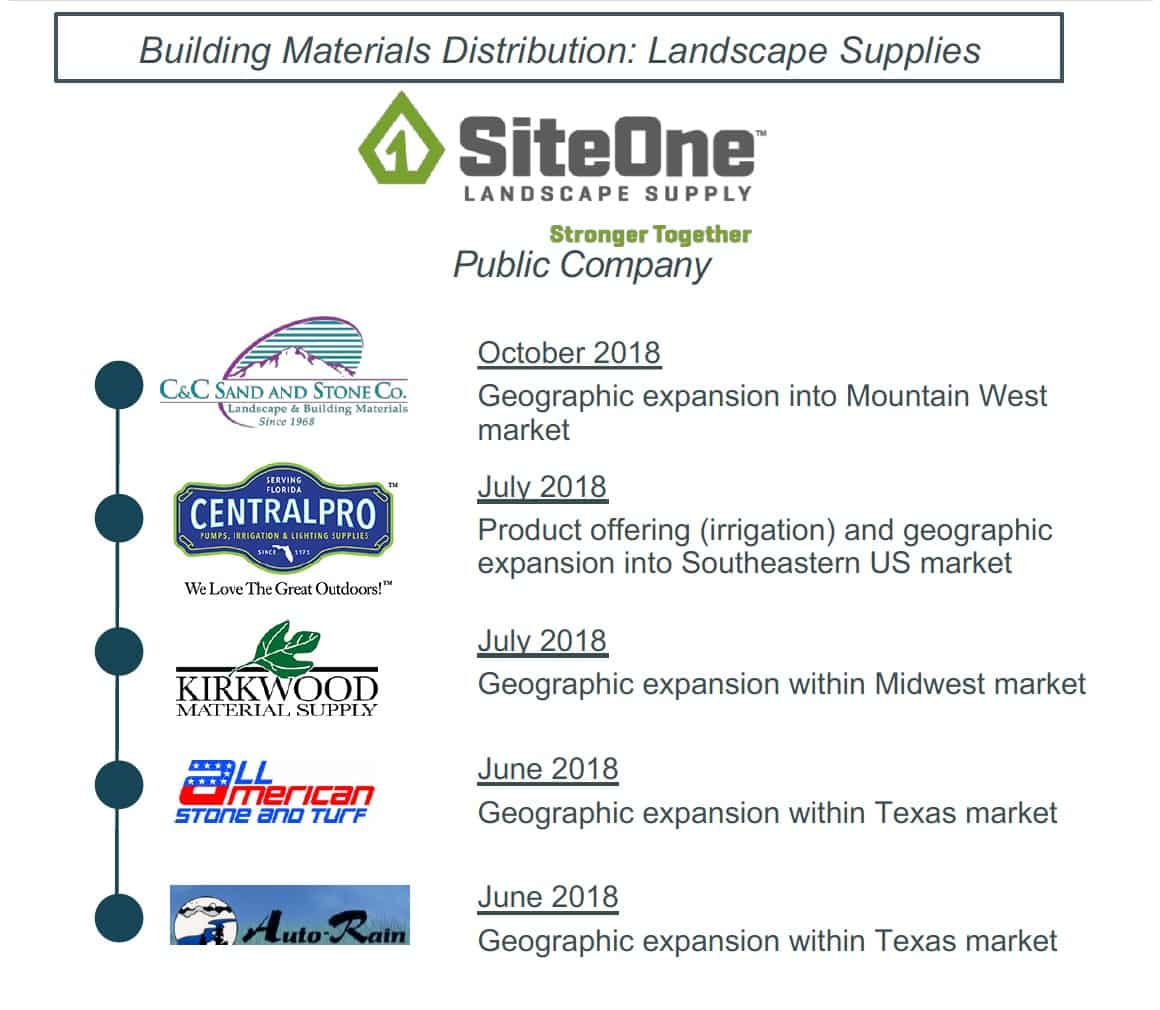
- One of the most active examples of geographic footprint expansion in 2018 has taken place within the building and landscape supply subsector. SiteOne Landscape Supply (NYSE:SITE) has lead the sector, completing 12 acquisitions through November. SiteOne’s expansion initiative has included adding new distribution properties in Colorado, Florida, Washington, Virginia, Boston, East Texas, and several other attractive metropolitan areas.
- On the international front, auto aftermarket distributor LKQ (Nasdaq:LKQ) recently acquired Stahlgruber, a leading European wholesale distributor of aftermarket spare parts. The CEO of LKQ Europe said of the transaction, “Stahlgruber will create a contiguous footprint and serve as an additional strategic hub for our European operations, allowing for continued improvement in procurement, logistics and infrastructure optimization.”
Distribution Subsectors Valuation Matrix
For distributors, gross margins are commonly indicative of the level of value-add or unique services offered. Valuations are typically centered on this dynamic with some exception for consolidation / M&A activity, rebate and buying group influence, contractual agreements, etc.
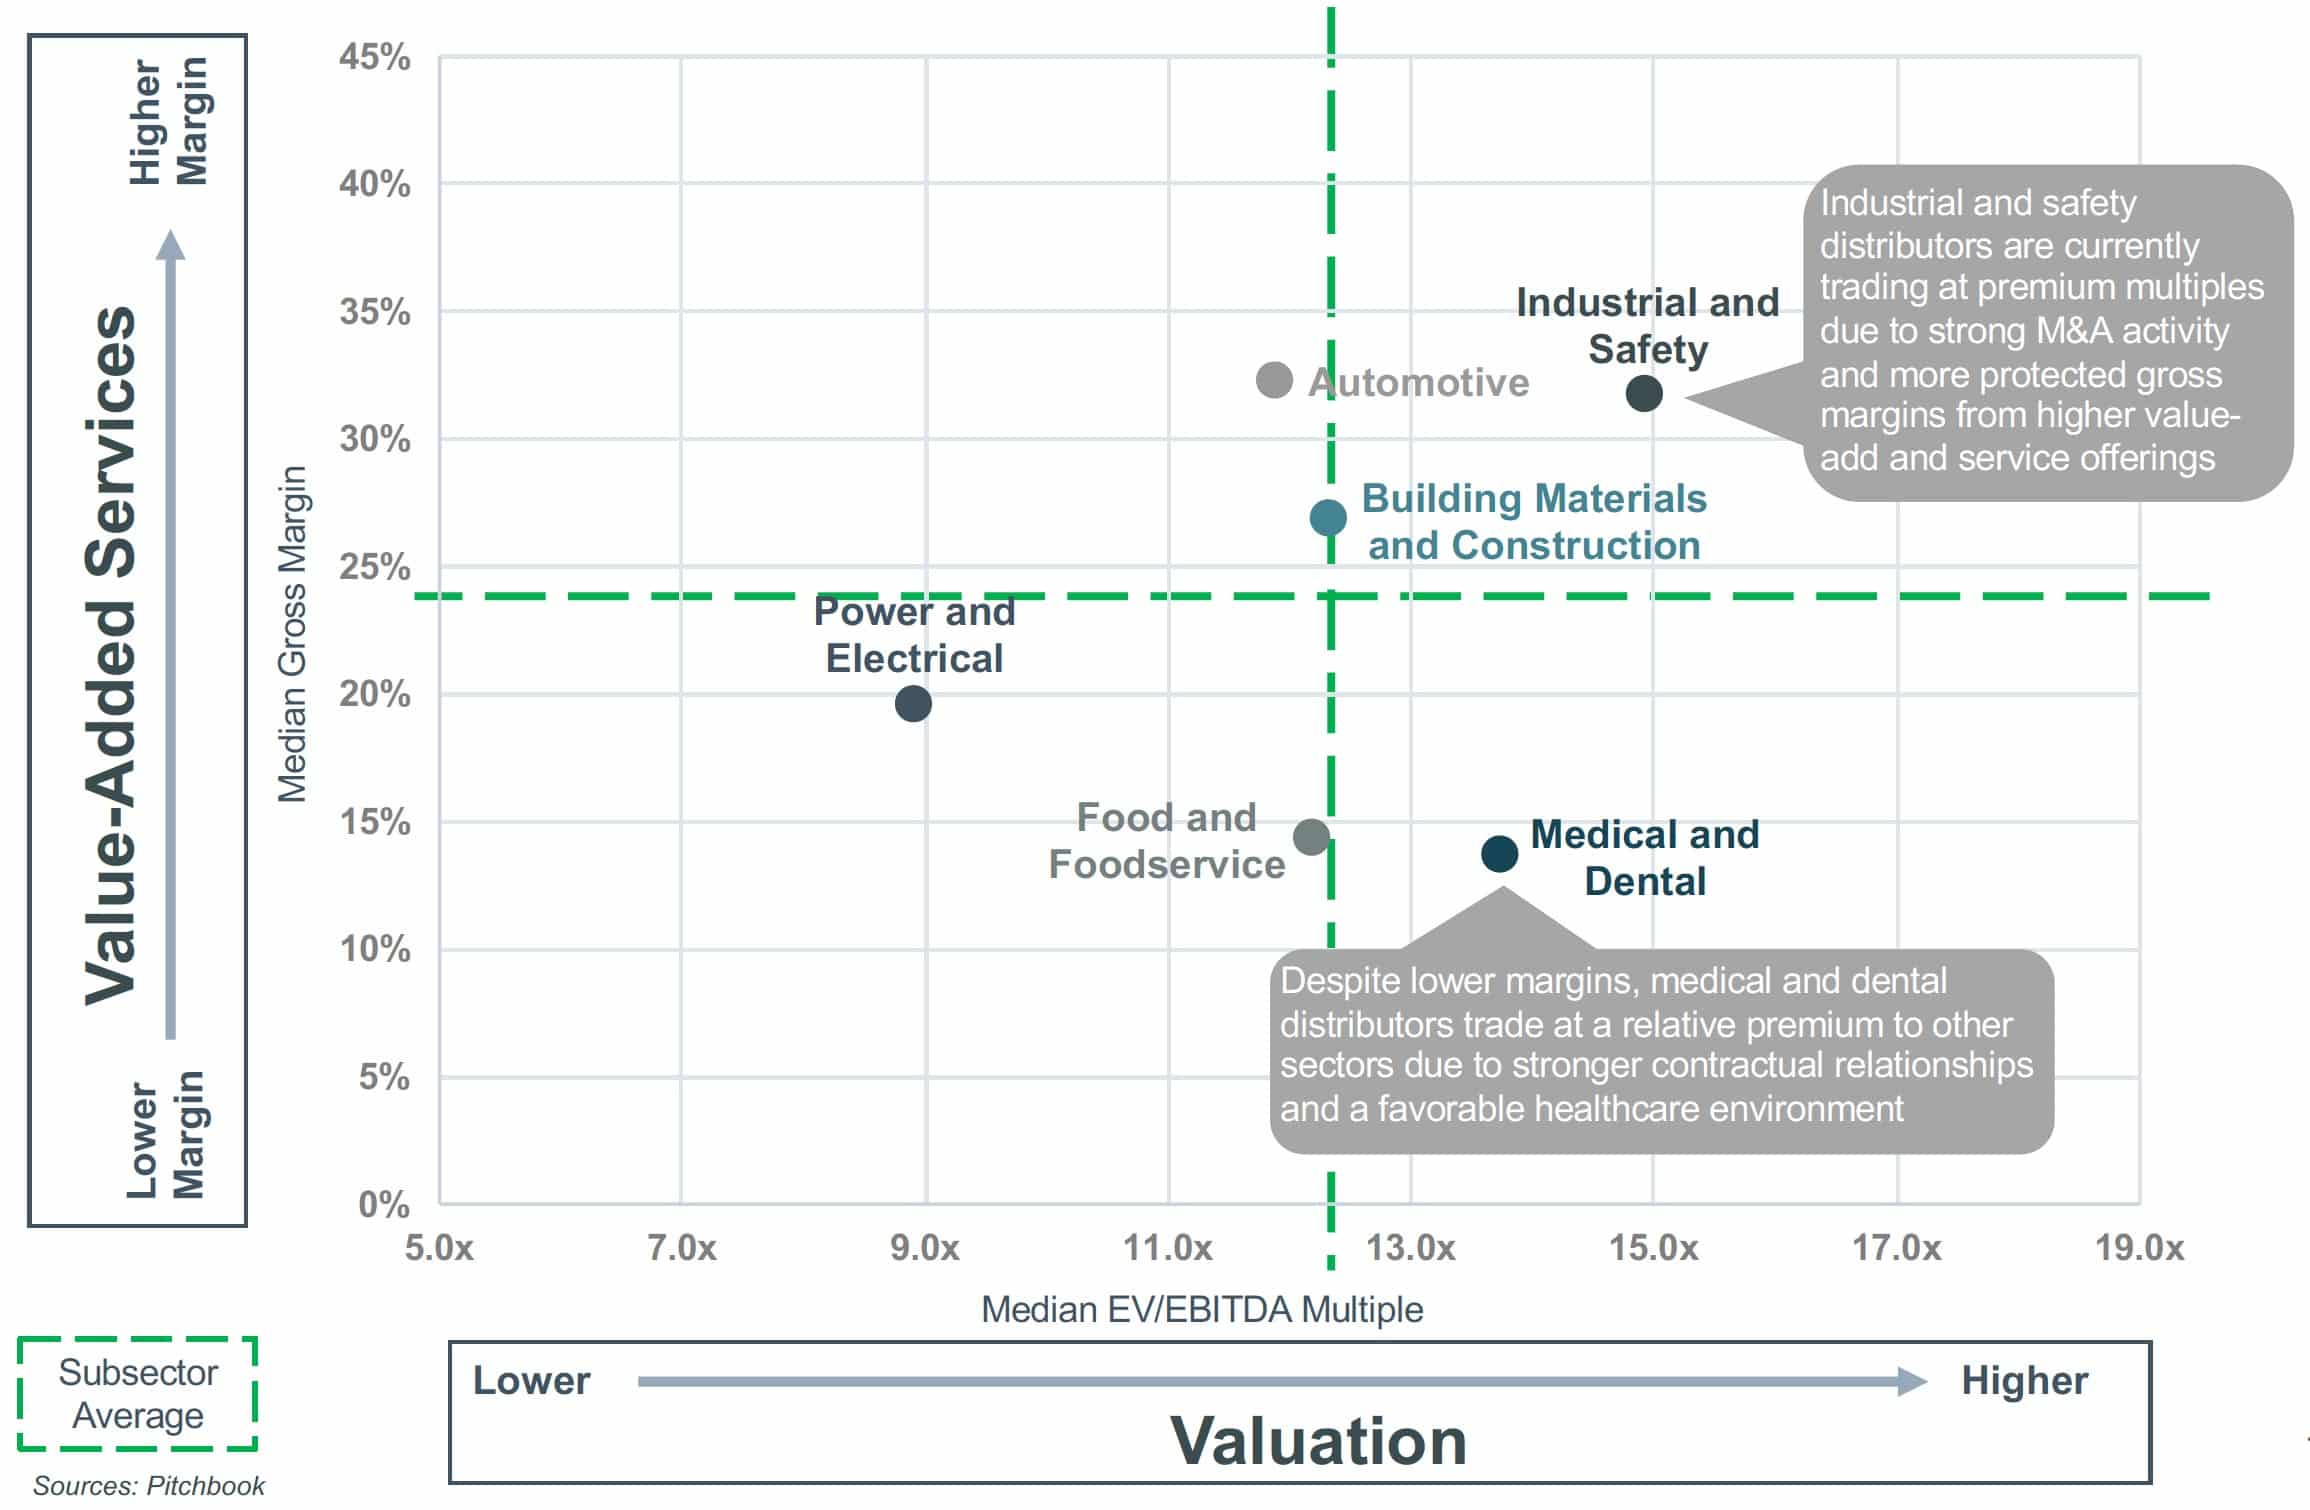
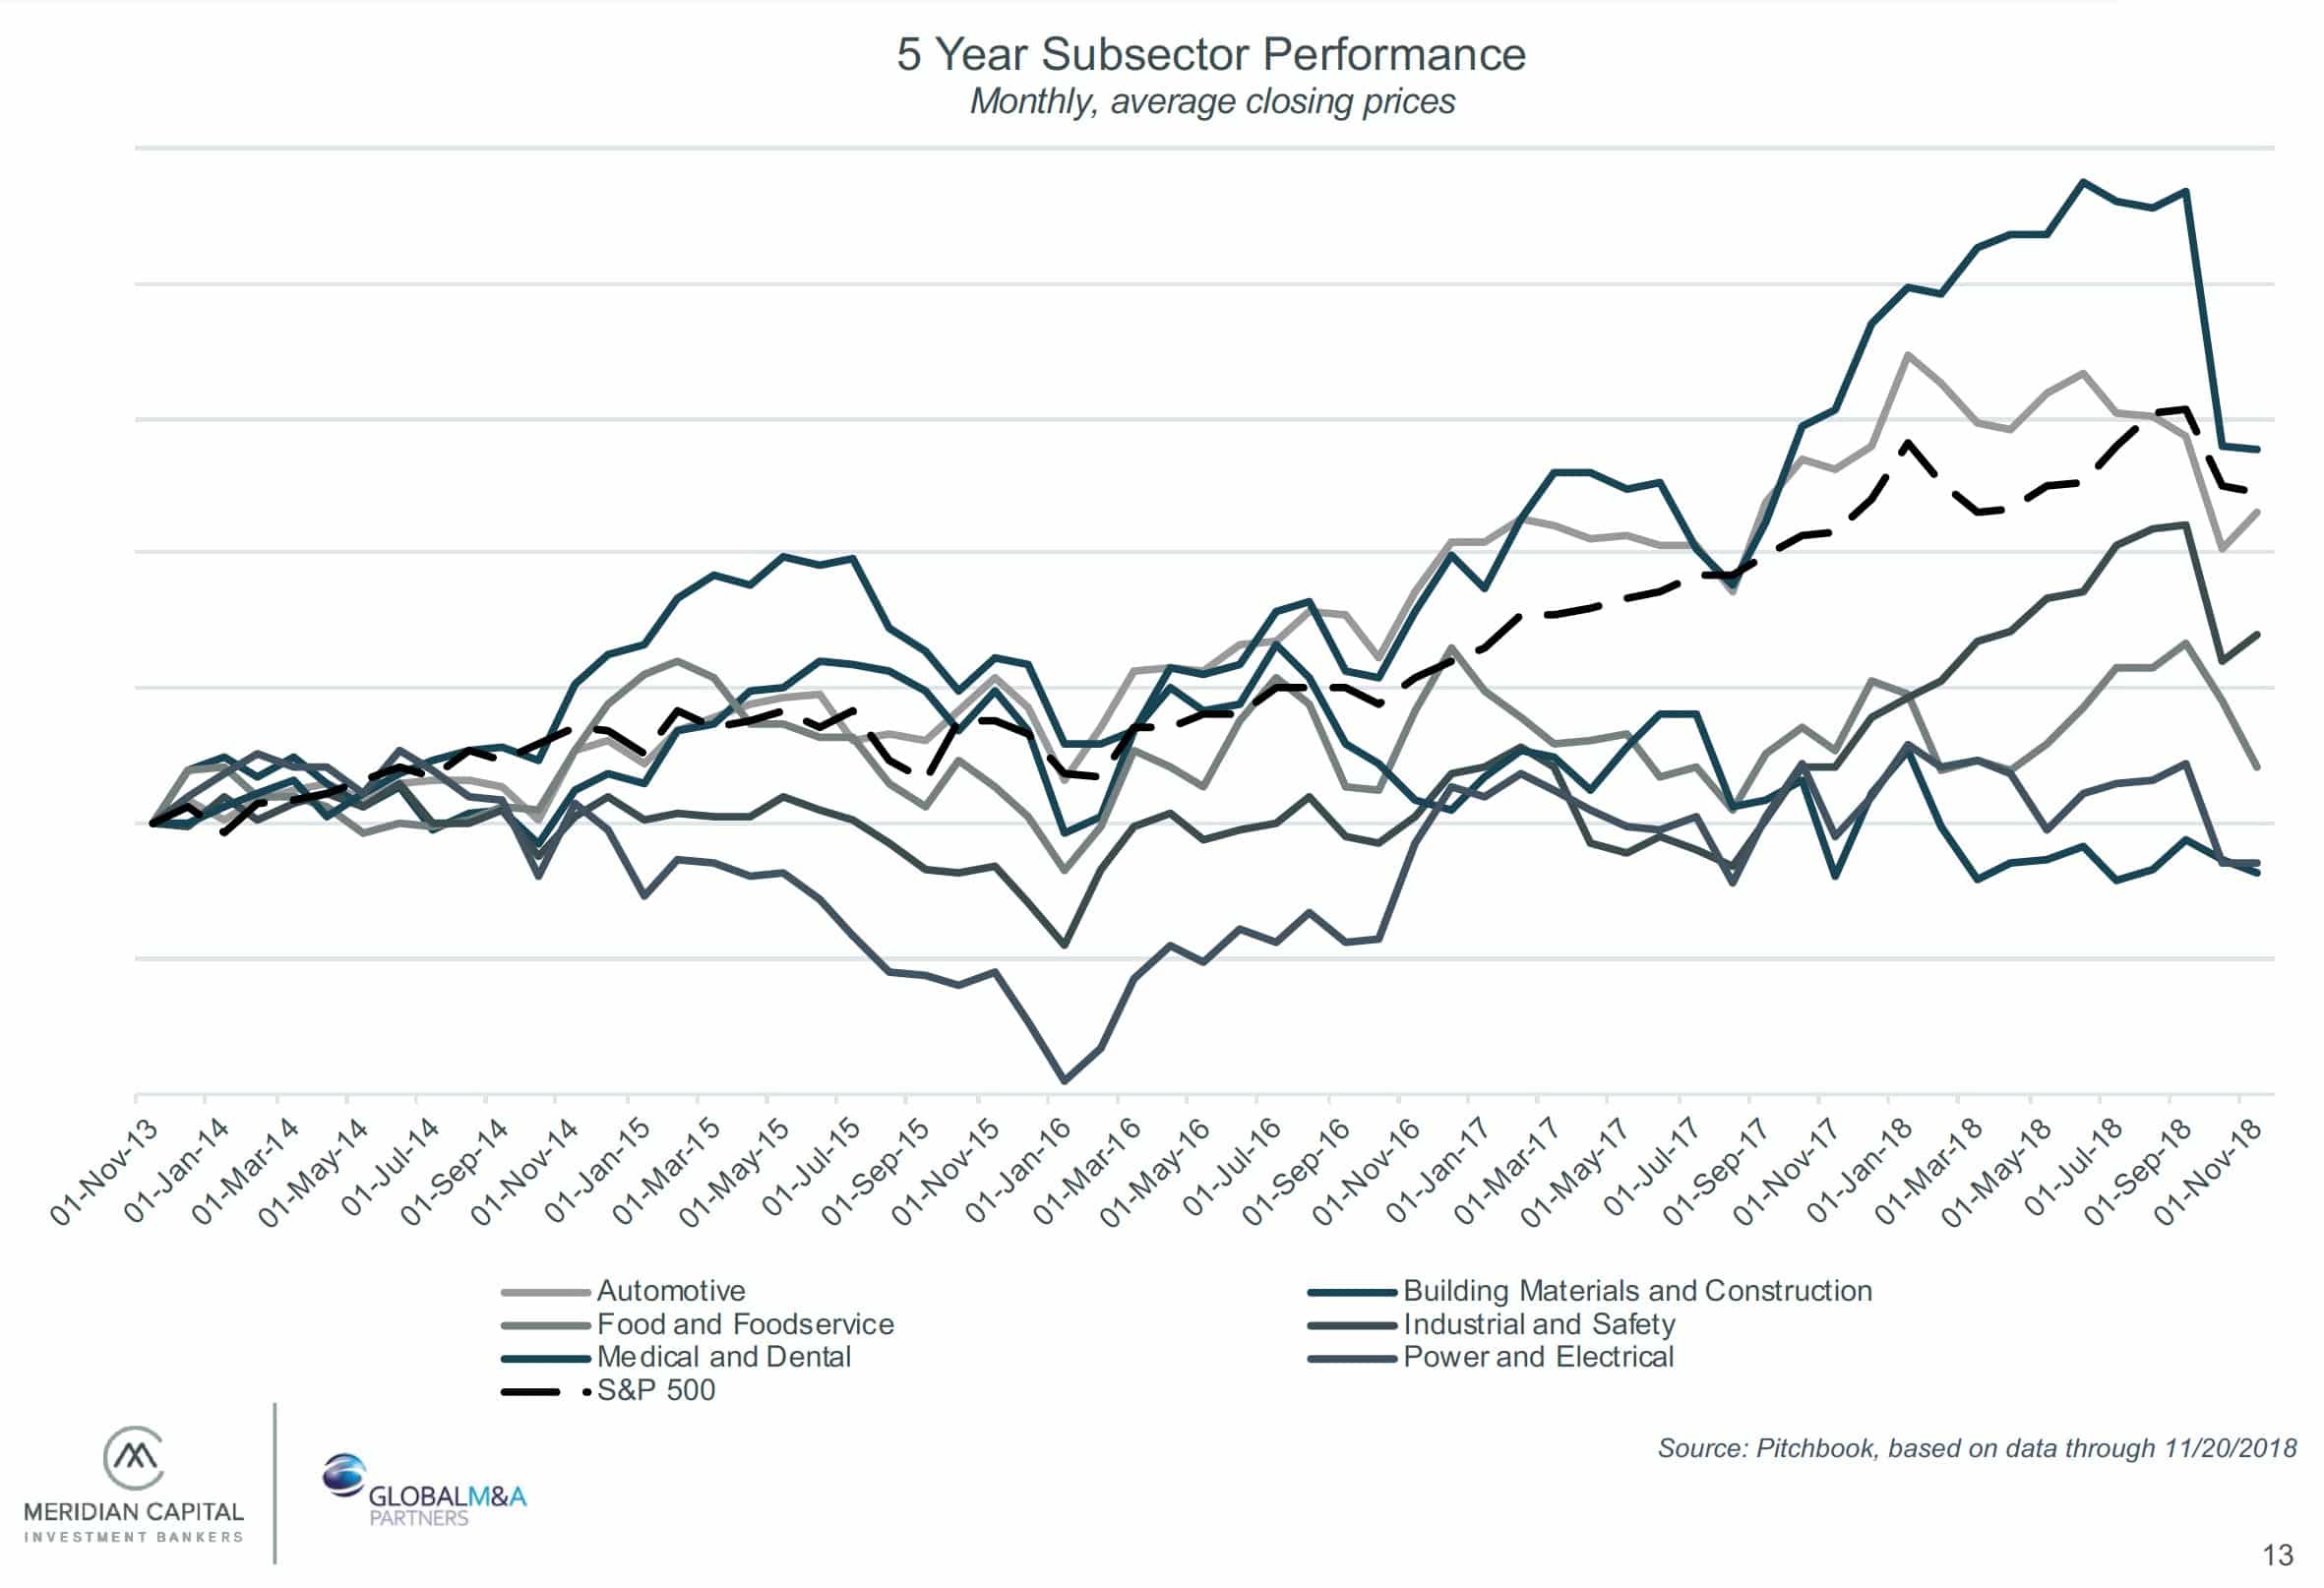
Distribution Performance Valuation Trends
Select Transaction Case Studies – Private Equity
Private Equity-Backed Roll-Up Strategy
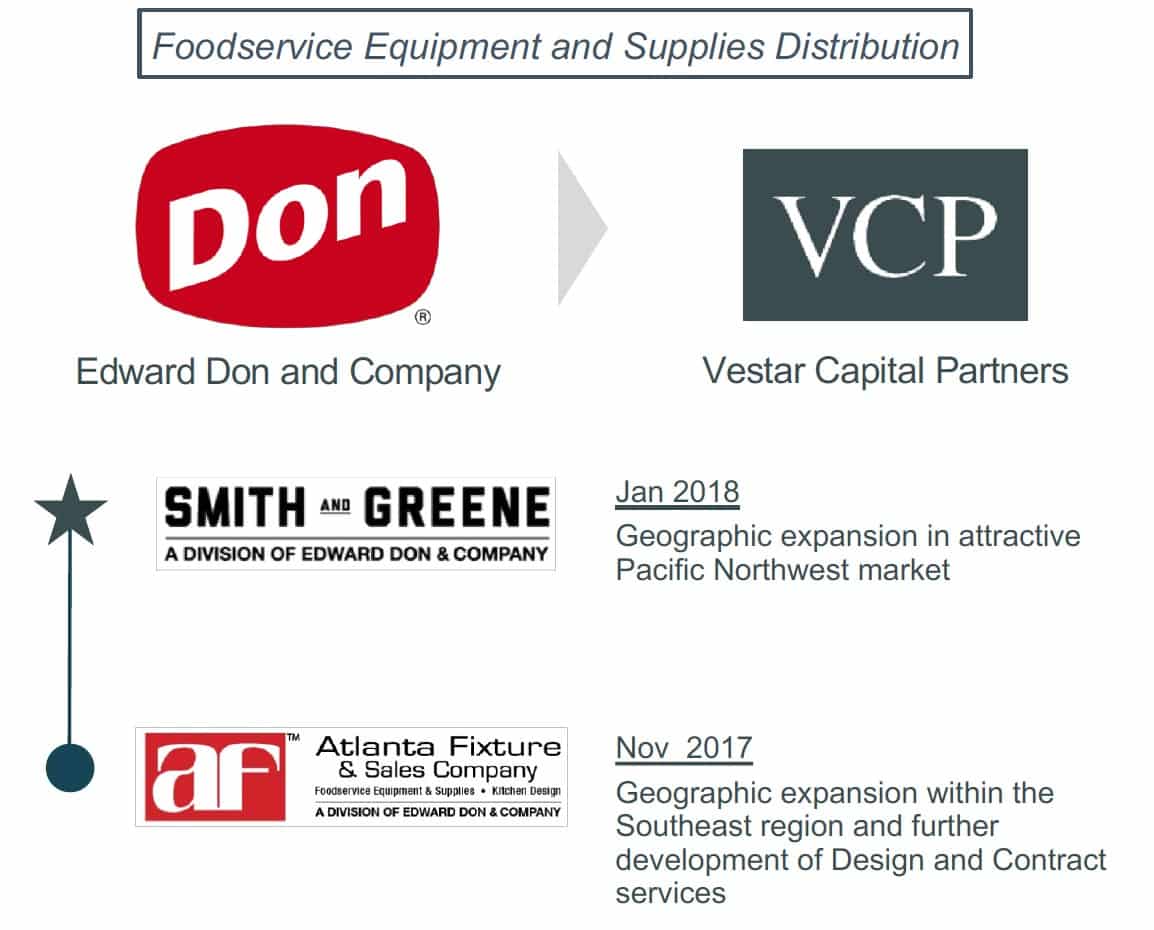
Rationale and Commentary
- The foodservice equipment and supplies industry has seen active consolidation among distributors in recent years as top participants have executed roll-up strategies backed by large private equity groups
- Key considerations for acquisitions include rebate programs and buying group relationships, customer concentration and length of relationship, and value-add services offerings
Private Equity – Platform Acquisition
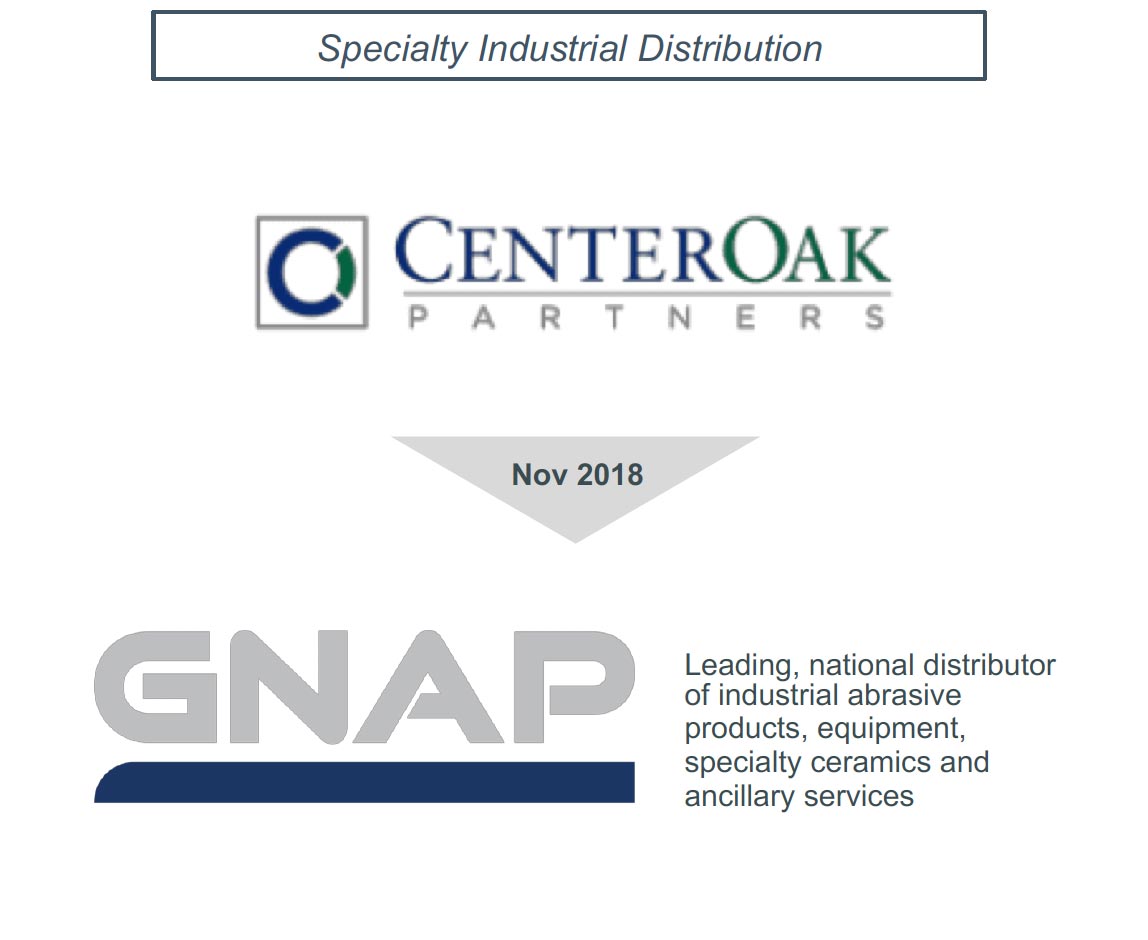
Rationale and Commentary
- Center Oak has an impressive track record of developing specialty distribution platforms, including significant experience supporting geographic and product line expansion strategies
- “We are very impressed with the Company’s emphasis on technical expertise, product category leadership and customer service – three pillars of a strong and scalable value proposition,” said Randall Fojtasek, Managing Partner of CenterOak
Select Transaction Case Studies – Strategic
Strategic Buyer – Targeted Roll-Up
Rationale and Commentary
- Landscape and irrigation distribution has seen a surge since 2016 with the top publicly-traded companies actively consolidating attractive geographies and expanding product lines and offerings
- SiteOne has made more than 12 acquisitions in the first three quarters of 2018 as the company remains focused on an aggressive M&A strategy
Strategic Buyer – “Blurring Lines” Acquisition
Rationale and Commentary
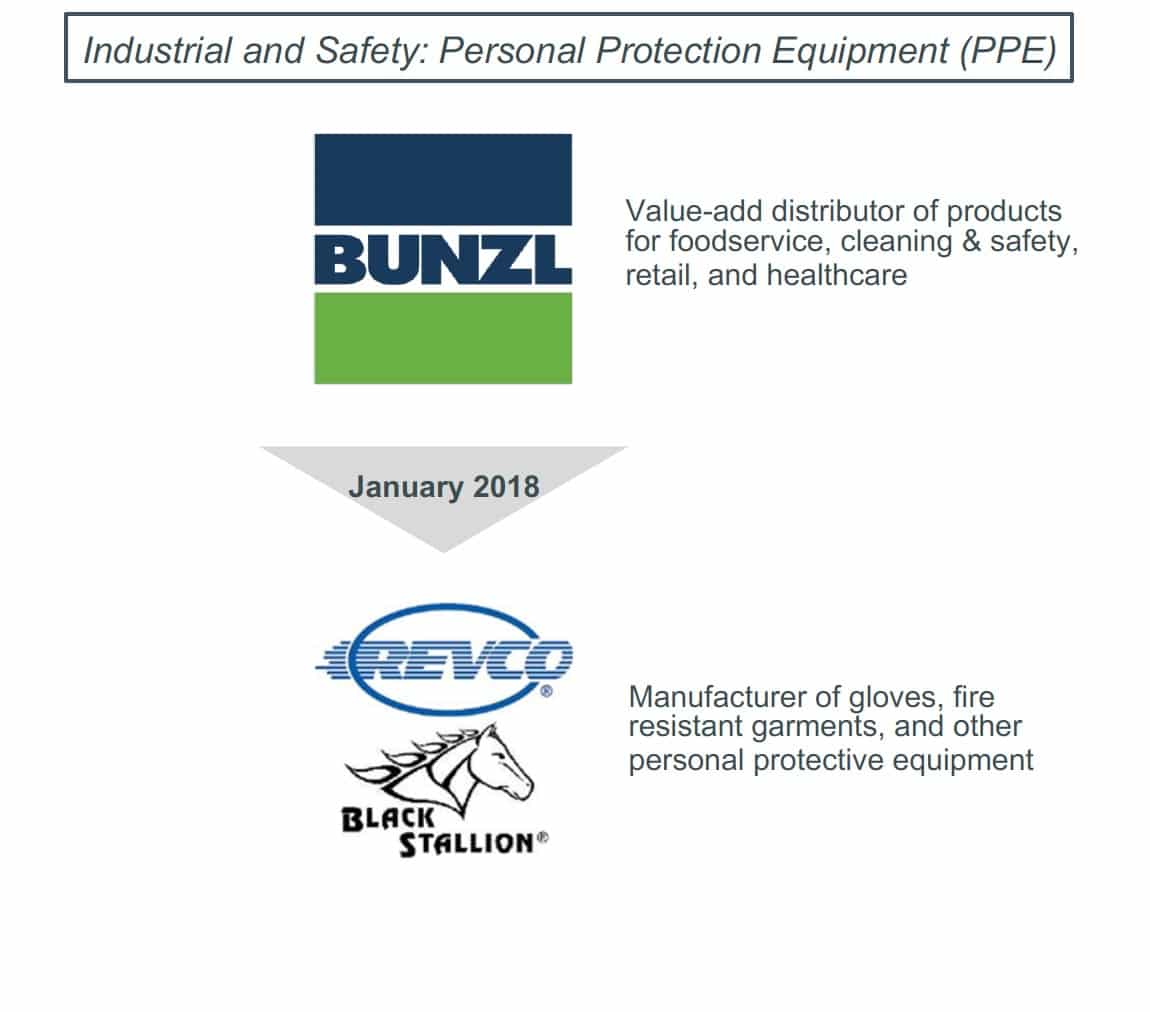
- Bunzl, a business focused primarily on distribution, has opportunistically made vertical acquisitions of select manufacturers in the safety space.
- “The acquisition of Revco represents a further development of our safety business in the U.S. with the business, in particular complementing and strengthening our existing presence in the welding and industrial supplies market,“ – Bunzl CEO Frank van Zanten
Notable Recent Transactions
| Date | Target | Buyer | Description | Sector | EV ($ in M) | Rev | EV/ EBITDA |
|---|---|---|---|---|---|---|---|
| Nov-18 | Individual FoodService | Trade Supplies (Sole Source Capital) | Distributor of food packaging, paper products, clearning supplies, and more | Food and Foodservice | – | – | – |
| Nov-18 | Specialty Products & Insulation Co | Dunes Point Capital | Distributor of mechanical insulation and complementary products | Industrial and Safety | – | – | – |
| Nov-18 | Grand Northern Products Ltd. | CenterOak Partners | Distributor of specialty industrial abrasive products and equipment | Industrial and Safety | – | – | – |
| Oct-18 | Supervalu, Inc. | United Natural Foods | Operator of grocery stores across United States | Food and Foodservice | $4,463.00 | 0.3x | 14.7x |
| Oct-18 | The Cook & Boardman Group LLC | Littlejohn & Co | Distributor of building specialty hardware and accessories for the architectural projects | Building Materials and Construction | – | – | – |
| Oct-18 | C&C Sand and Stone Co. | SiteOne Landscape Supply | Supplier of landscape and masonry building materials | Building Materials and Construction | – | – | – |
| Oct-18 | Indiana Limestone Company | Polycor (TorQuest Partners) | Provider and distributor of dimensional limestone products | Building Materials and Construction | – | – | – |
| Oct-18 | Skyline Equipment, Inc. | Envirostar | Distributor of laundry equipment | Other | – | – | – |
| Oct-18 | Worldwide Laundry, Inc. | Envirostar | Distributor of vended and on-premise laundry products | Other | – | – | – |
| Oct-18 | Heads & Threads International, Inc. | Lawson Products | Distributor of industrial fasteners and related products | Industrial and Safety | – | – | – |
| Oct-18 | Motion & Control Enterprises LLC | Frontenac | Distributor of motion and control systems, industrial lubrication equipment, and power tools | Power and Electrical | – | – | – |
| Sep-18 | LINC Systems, Inc. | Center Rock Capital Partners | Distributor of pneumatic tools, compressors, and fasteners | Industrial and Safety | – | – | – |
| Sep-18 | Bolcof-Port Polymers | Ravago Manufacturing Americas | Distributor of thermoplastic resins products | Other | – | – | – |
| Sep-18 | Foundation Building Materials | Dunes Point Capital | Distributor of insulation products | Building Materials and Construction | $123.00 | – | – |
| Sep-18 | Tidewater Equipment | Tecum Capital | Distributor of industrial and forestry equipment for the logging industries | Industrial and Safety | – | – | – |
| Sep-18 | Stelfast, Inc. | Lindstrom Metric (Audax Group, Harbour Group) | Manufacturer and distributor of fasteners | Industrial and Safety | – | – | – |
| Sep-18 | Hastings Auto Parts | Genuine Parts | Distributor of fuel and water pumps and other products for the auto industry | Automotive | – | – | – |
| Sep-18 | Hydraulic Supply | Genuine Parts | Distributor of fluid power products | Automotive | – | – | – |
| Sep-18 | LINC Systems (USA) | Center Rock Capital Partners | Distributor of pneumatic tools, compressors, and fasteners to various industries | Power and Electrical | – | – | – |
| Sep-18 | Nexeo Solutions (NAS: NXEOU) | Univar | Distributor of chemicals and thermoplastic products in the U.S. | Other | $1,956.00 | 0.5x | 9.4x |
| Sep-18 | Scott Equipment, Inc. | Envirostar | Distributor of on-premise and vended laundry products | Other | $13.00 | 0.3x | – |
| Aug-18 | Contract Hardware of Florida, Inc. | The Cook & Boardman Group | Distributor of commercial doors and hardware | Building Materials and Construction | – | – | – |
| Aug-18 | Long Island Truck Parts Inc | FleetPride (TPG Capital) | Distributor of trucks engine parts, water pumps, air conditioning equipment, and chassis | Automotive | – | – | – |
| Aug-18 | Enhanced Medical Services, LLC | Lombart Instrument (Atlantic Street Capital) | Distributor of new and pre-owned eye care equipment | Medical and Dental | – | – | – |
| Aug-18 | EPKO Industries, Inc. | ShoreView Industries | Distributor and supplier of wall coverings and vertical interior surfaces | Building Materials and Construction | – | – | – |
| Jul-18 | SGA’s Food Group of Companies | US Foods | Distributor of food and food products | Food and Foodservice | $1,800.00 | – | 14.6x |
| Jul-18 | Atlas Supply, Inc. | Beacon Roofing Supply | Distributor of sealants, coatings, adhesives and related waterproofing products | Industrial and Safety | $24.00 | – | |
| Jul-18 | Alabama Bolt and Supply Incorporated | Air Hydro Power | Distributor of hydraulic, automation, fluid connectors and pneumatic products | Power and Electrical | – | – | – |
| Jul-18 | MORSCO, Inc. | Reece | Distributor of commercial and residential plumbing, waterworks and HVAC supplies | Building Materials and Construction | $1,061.00 | 0.6x | – |
| Jun-18 | Arrowhead Electrical Products, Inc. | Ares Capital Corporation | Distributor of rotating electrical parts and components | Power and Electrical | – | – | – |
| Jun-18 | All American Stone & Turf LLC | SiteOne Landscape Supply | Distributor of landscape products in Texas, United States | Building Materials and Construction | – | – | – |
| Jun-18 | American Chemcials and Equipment | Imperial Dade (Audax Group) | Distributor of janitorial, sanitation, food service and office supply products and services | Industrial and Safety | – | – | – |
| Jun-18 | G & F Roof Supply, Inc. | ABC Supply Company | Distributor of roofing products in California | Building Materials and Construction | – | – | – |
| Jun-18 | Wesco Group, Inc. | Tinicum | Distributor and supplier of paint and related equipment across the Western United States | Automotive | – | – | – |
| Jun-18 | Auto-Rain Supply, Inc. | SiteOne Landscape Supply | Distributor of irrigation and landscape products in United States | Building Materials and Construction | – | – | – |
| Jun-18 | Cleaning Supply Warehouse, Inc. | Aramsco (AEA Investors) | Distributor of cleaning supplies and equipment | Industrial and Safety | – | – | – |
| Jun-18 | Medical Specialties Distributors, LLC | McKesson | Distributor of healthcare products and provider of biomedical repair services | Medical and Dental | $800.00 | – | – |
| May-18 | Stahlgruber GmbH | LKQ Corporation | Distributor and retailer of automotive parts and related accessories | Automotive | $2,181.00 | 1.2x | 15.1x |
| May-18 | SRS Distribution, Inc. | Leonard Green & Partners | Distributor of residential roofing materials and supplies | Building Materials and Construction | $3,000.00 | – | 15.0x |
| May-18 | American CleanStat, LLC | Thomas Scientific (The Carlyle Group) | Distributor of gloves, wipers, apparel, garments, and laboratory equipment | Medical and Dental | – | – | – |
| May-18 | 3Wire Group Inc. | Parts Town (Berkshire Partners) | Distributor of foodservice equipment parts | Food and Foodservice | – | – | – |
| May-18 | TruTemp Equipment, Inc. | Empire Marketing Group (Kian Capital) | Distributor of food service equipment | Food and Foodservice | – | – | – |
| May-18 | E&K Scientific Products, Inc. | Thomas Scientific (The Carlyle Group) | Distributor of life science research products | Medical and Dental | – | – | – |
| Apr-18 | All Integrated Solutions | Msc Industrial Direct Co | Distributor of industrial fasteners and components | Industrial and Safety | $98.00 | 3.6x | – |
| Apr-18 | General Distributors, Inc. | Columbia Distributing | Distributor and marketer of beverages | Food and Foodservice | – | – | – |
| Apr-18 | Halyard Health (partial) | Owens & Minor | Provider of surgical and infection prevention services | Medical and Dental | $710.00 | – | – |
| Apr-18 | Ryan Herco Flow Solutions, Inc. | SunSource (CD&R, Littlejohn & Co) | Distributor of filtration and fluid handling products in the United States | Power and Electrical | – | – | – |
| Apr-18 | Girtman & Associates, Inc. | The Cook & Boardman Group (Ridgemont Equity) | Distributor of commercial doors, frames and architectural hardware | Building Materials and Construction | – | – | – |
| Apr-18 | Bellingham Glove, Inc. | Radians Importer and | distributor of gloves | Industrial and Safety | – | – | – |
| Apr-18 | Bush Supply, Inc. | MORSCO (Advent International) | Distributor of HVAC products and services | Building Materials and Construction | – | – | – |
| Apr-18 | Blue Sky Industries, Inc. | Aircraft Fasteners International (Audax, Prospect) | Distributor of aircraft components, parts and materials | Industrial and Safety | – | – | – |
| Apr-18 | Monte Package Co. | Bunzl | Distributor of packaging products created to serve the fresh food growers and packers | Industrial and Safety | – | – | – |
| Apr-18 | A&W Oil Company, Inc | RelaDyne (Audax Group) | Distributor and retailer of commercial, automotive and aviation fuels and lubricants | Automotive | – | – | – |
| Apr-18 | Sarnova, Inc. | Patricia Industries (Water Street Healthcare) | Distributor of healthcare products | Medical and Dental | $1,050.00 | $2.00 | $16.00 |
| Apr-18 | Kent Frozen Foods Limited | Sysco | Distributor and dealer of discount tires | Food and Foodservice | – | – | – |
| Mar-18 | Mavis Tire | Golden Gate Capital | Provider of food distribution services | Automotive | – | – | – |
| Mar-18 | Preferred Medical Supply, LLC | NDC (AEA Investors) | Distributor of medical equipment and supplies to the post-acute care market | Medical and Dental | – | – | – |
| Mar-18 | A.H. Harris & Sons, Inc. | HD Supply | Supplier of high-quality construction products and equipment | Building Materials and Construction | $380.00 | 1.0x | – |
| Mar-18 | Lentz Milling Company | JM Swank Company (Platinum Equity) | Distributor of food ingredients for bakeries and food manufacturers | Food and Foodservice | – | – | – |
| Mar-18 | Foster Mechanical Corporation | SBP Holdings (AEA Investors) | Distributor and fabricator of industrial parts and components in Saint Louis, Missouri | Industrial and Safety | – | – | – |
| Feb-18 | Doerle Food Services, LLC | Sysco | Distributor of food products | Food and Foodservice | – | – | – |
| Feb-18 | ZXP Technologies, LLC. | Milton Street Capital | Distributor and provider of blended lubricant-based products and packaging services | Automotive | – | – | – |
| Feb-18 | Sikes Paper & Chemical Supply, Inc. | Imperial Dade (Audax Group) | Distributor of sanitary paper, janitorial, chemical and packaging supplies | Industrial and Safety | – | – | – |
| Feb-18 | Smith Industrial Rubber & Plastics, Inc. | SBP Holdings (AEA Investors) | Distributor and fabricator of industrial rubber products in the United States | Industrial and Safety | – | – | – |
| Feb-18 | Omni Packaging, Inc. | SupplyOne (Wellspring Capital Management) | Distributor of shipping and packaging materials to businesses | Industrial and Safety | – | – | – |
| Feb-18 | Cincinnati Hose & Fittings, Inc. | Triad Technologies (Svoboda Capital Partners) | Distributor of fluid connectors | Power and Electrical | – | – | – |
| Jan-18 | FCX Performance, Inc. | Applied Industrial Technologies | Distributor of flow control and process automation products in North America | Power and Electrical | $784.00 | 1.4x | 11.5x |
| Jan-18 | PCA Industrial & Paper Supplies, Inc. | Imperial Dade (Audax Group) | Distributor of paper products, janitorial supplies and cleaning equipment | Industrial and Safety | – | – | – |
| Jan-18 | AmeriPride Services, Inc. | Aramark Supplier of uniforms and towels | Distributor of industrial fasteners and service provider for kitting, packaging and quality | Food and Foodservice | $1,000.00 | 1.7x | – |
| Jan-18 | THB, Inc. | Fairmont Supply (Tenex Capital Management) | Distributor of surface preparation equipment and consumables | Industrial and Safety | – | – | – |
| Jan-18 | Revco Industries, Inc | Bunzl | Manufacturer of workplace safety and personal protection equipment | Industrial and Safety | – | – | – |
| Jan-18 | JAD Equipment Co., Inc. | Fidus Investment | Distributor of products, software and value added IT services | Building Materials and Construction | – | – | – |
| Jan-18 | Commtech Distribution Ltd. | Arrow Electronics | Distributor of healthcare distribution services | Power and Electrical | – | – | – |
| Jan-18 | RxCrossroads LLC | McKesson | Provider of pharmaceutical distribution services | Medical and Dental | $735.00 | – | – |
| Jan-18 | H. D. Smith & Co. | AmerisourceBergen | Distributor of complete range of packaging products, including bottles, caps, and dividers | Medical and Dental | $815.00 | – | – |
| Jan-18 | Package All Corp. | TricorBraun (AEA Investors) | Distributor of equipment for compressed gas delivery, beverage production, and fire | Industrial and Safety | – | – | – |
| Jan-18 | All Safe Global, Inc. | Capital Resource Partners (River Birch Partners) | Industrial and Safety | – | – | – | |
| Median | $808.00 | 1.1x | 14.7x | ||||
| Mean | $1,166.00 | 1.3x | 13.7x |
Distribution Subsectors – Public Companies
Automotive
| Company Name | Ticker | Market Cap | Net Debt | Enterprise Value | Revenue LTM | EBITDA LTM | EV / Revenue | EV / EBITDA | Gross Margin | Total Debt / EBITDA | EBITDA Margin |
|---|---|---|---|---|---|---|---|---|---|---|---|
| Genuine Parts Company | NYS:GPC | $14,830.00 | $2,554.80 | $17,436.90 | $18,338.40 | $1,365.20 | 1.0x | 12.8x | 31.2% | 2.1x | 7.4% |
| LKQ Corporation | NAS:LKQ | 8,387.8 | 4,027.2 | 12,471.9 | 11,343.7 | 1,162.7 | 1.1x | 10.7x | 38.4% | 3.8x | 10.2% |
| Lear Corp | NYS:LEA | 8,523.6 | 765.2 | 9,593.2 | 21,569.9 | 2,148.5 | 0.4x | 4.5x | 11.0% | 0.9x | 10.0% |
| Dorman Products, Inc. | NAS:DORM | 2,828.1 | -53.1 | 2,775.0 | 941.1 | 196.0 | 2.9x | 14.2x | 39.0% | nm | 20.8% |
| Kaman Corporation | NYS:KAMN | 1,533.0 | 278.1 | 1,811.1 | 1,848.4 | 101.3 | 1.0x | 17.9x | 29.7% | 3.0x | 5.5% |
| Uni-Select Inc. | TSE:UNS | 657.7 | 393.6 | 1,051.3 | 1,747.5 | 116.8 | 0.6x | 9.0x | 33.2% | 3.5x | 6.7% |
| Median | $5,608.00 | $579.40 | $6,184.10 | $6,596.10 | $679.30 | 1.0x | 11.7x | 32.2% | 3.0x | 8.7% | |
| Average | $6,126.70 | $1,327.60 | $7,523.20 | $9,298.20 | $848.40 | 1.2x | 11.5x | 30.4% | 2.7x | 10.1% |
Building Materials and Construction
| Company Name | Ticker | Market Cap | Net Debt | Enterprise Value | Revenue LTM | EBITDA LTM | EV / Revenue | EV / EBITDA | Gross Margin | Total Debt / EBITDA | EBITDA Margin |
|---|---|---|---|---|---|---|---|---|---|---|---|
| Ferguson PLC | LON:FERG | $14,093.90 | $1,164.00 | $15,256.90 | $20,752.00 | $1,494.00 | 0.7x | 10.2x | 29.1% | 1.3x | 7.2% |
| HD Supply, Inc. | NAS:HDS | 7,069.3 | 1,847.0 | 8,916.3 | 5,784.0 | 722.0 | 1.5x | 12.3x | 39.3% | 2.6x | 12.5% |
| Pool Corporation | NAS:POOL | 6,301.6 | 545.0 | 6,846.6 | 2,965.2 | 332.7 | 2.3x | 20.6x | 28.8% | 1.7x | 11.2% |
| SiteOne Landscape Supply, Inc. | NYS:SITE | 2,515.0 | 566.0 | 3,081.0 | 2,053.4 | 155.2 | 1.5x | 19.9x | 32.2% | 3.8x | 7.6% |
| Beacon Roofing Supply, Inc. | NAS:BECN | 2,260.3 | 2,490.5 | 5,150.0 | 6,418.3 | 406.1 | 0.8x | 12.7x | 24.8% | 6.5x | 6.3% |
| Summit Materials, Inc. | NYS:SUM | 1,502.9 | 1,763.0 | 3,279.9 | 2,100.0 | 649.4 | 1.6x | 5.1x | 31.0% | 2.8x | 30.9% |
| Builders FirstSource, Inc. | NAS:BLDR | 1,433.5 | 1,807.1 | 3,240.6 | 7,687.7 | 438.2 | 0.4x | 7.4x | 24.2% | 4.2x | 5.7% |
| BMC Stock Holdings Inc. | NAS:BMCH | 1,120.2 | 304.9 | 1,425.1 | 3,663.8 | 231.4 | 0.4x | 6.2x | 23.9% | 1.6x | 6.3% |
| Boise Cascade Company | NYS:BCC | 1,003.5 | 257.8 | 1,261.3 | 5,021.5 | 251.3 | 0.3x | 5.0x | 14.1% | 1.7x | 5.0% |
| BlueLinx Corp. | NYS:BXC | 234.8 | 763.0 | 997.7 | 2,623.8 | 7.4 | 0.4x | 134.8x | 11.7% | 104.1x | 0.3% |
| Median | $1,881.60 | $963.50 | $3,260.30 | $4,342.60 | $369.40 | 0.8x | 11.3x | 26.8% | 2.7x | 6.8% | |
| Average | $3,753.50 | $1,150.80 | $4,945.60 | $5,907.00 | $468.80 | 1.0x | 23.4x | 25.9% | 13.0x | 9.3% |
Food and Foodservice
| Company Name | Ticker | Market Cap | Net Debt | Enterprise Value | Revenue LTM | EBITDA LTM | EV / Revenue | EV / EBITDA | Gross Margin | Total Debt / EBITDA | EBITDA Margin |
|---|---|---|---|---|---|---|---|---|---|---|---|
| Sysco Corporation | NYS:SYY | $34,274.80 | $7,911.50 | $42,223.10 | $59,292.20 | $3,124.80 | 0.7x | 13.5x | 18.9% | 2.8x | 5.3% |
| Aramark Corp. | NYS:ARMK | 9,289.5 | 7,029.0 | 16,328.5 | 15,789.6 | 1,411.9 | 1.0x | 11.6x | 11.4% | 5.1x | 8.9% |
| US Foods, Inc. | NYS:USFD | 6,995.1 | 3,596.1 | 10,591.2 | 24,129.7 | 1,011.8 | 0.4x | 10.5x | 17.8% | 3.6x | 4.2% |
| Performance Food Group, Inc. | NYS:PFGC | 3,547.1 | 1,225.0 | 4,772.1 | 17,794.7 | 388.2 | 0.3x | 12.3x | 13.1% | 3.2x | 2.2% |
| Core-Mark International Inc. | NAS:CORE | 1,148.1 | 373.5 | 1,521.6 | 16,377.6 | 112.4 | 0.1x | 13.5x | 5.3% | 3.7x | 0.7% |
| United Natural Foods, Inc. | NAS:UNFI | 1,002.6 | 3,916.2 | 4,917.1 | 10,637.3 | 244.7 | 0.5x | 20.1x | 14.7% | 16.2x | 2.3% |
| The Chefs’ Warehouse, Inc | NAS:CHEF | 1,127.5 | 230.4 | 1,357.9 | 1,407.7 | 68.0 | 1.0x | 20.0x | 25.3% | 4.1x | 4.8% |
| SpartanNash Company | NAS:SPTN | 647.3 | 682.4 | 1,329.6 | 8,217.5 | 184.2 | 0.2x | 7.2x | 13.6% | 3.8x | 2.2% |
| Median | $2,347.60 | $2,410.60 | $4,844.60 | $16,083.60 | $316.40 | 0.5x | 12.9x | 14.2% | 3.7x | 3.2% | |
| Average | $7,254.00 | $3,120.50 | $10,380.10 | $19,205.80 | $818.30 | 0.5x | 13.6x | 15.0% | 5.3x | 3.8% |
Industrial and Safety
| Company Name | Ticker | Market Cap | Net Debt | Enterprise Value | Revenue LTM | EBITDA LTM | EV / Revenue | EV / EBITDA | Gross Margin | Total Debt / EBITDA | EBITDA Margin |
|---|---|---|---|---|---|---|---|---|---|---|---|
| Praxair Technology, Inc | NYS:LIN | $89,766.90 | $7,712.00 | $97,996.90 | $12,037.00 | $3,862.00 | 8.1x | 25.4x | 43.8% | 2.2x | 32.1% |
| W.W. Grainger, Inc. | NYS:GWW | 16,871.9 | 1,718.0 | 18,752.2 | 11,090.5 | 1,350.7 | 1.7x | 13.9x | 38.8% | 1.7x | 12.2% |
| Fastenal Company | NAS:FAST | 16,448.3 | 260.3 | 16,708.6 | 4,822.0 | 1,103.7 | 3.5x | 15.1x | 48.6% | 0.4x | 22.9% |
| Bunzl plc | LON:BNZL | 9,877.1 | 1,925.7 | 11,802.7 | 11,849.7 | 755.8 | 1.0x | 15.6x | *17.0% | 3.4x | 6.4% |
| Watsco, Inc. | NYS:WSO | 5,767.5 | 49.1 | 6,109.9 | 4,519.7 | 397.0 | 1.4x | 15.4x | 24.6% | 0.3x | 8.8% |
| Univar, Inc. | NYS:UNVR | 2,817.1 | 2,523.8 | 5,340.9 | 8,620.5 | 608.9 | 0.6x | 8.8x | 22.0% | 4.3x | 7.1% |
| DNOW L.P. | NYS:DNOW | 1,515.7 | 79.0 | 1,594.7 | 3,032.0 | 80.0 | 0.5x | 19.9x | 19.8% | 2.1x | 2.6% |
| MRC Global, Inc. | NYS:MRC | 1,359.4 | 690.0 | 2,404.4 | 4,066.0 | 168.0 | 0.6x | 14.3x | 16.2% | 4.3x | 4.1% |
| Law son Products, Inc. | NAS:LAWS | 272.9 | 7.8 | 280.7 | 344.0 | 11.8 | 0.8x | 23.7x | 55.4% | 1.3x | 3.4% |
| Median | $5,767.50 | $690.00 | $6,109.90 | $4,822.00 | $608.90 | 1.0x | 15.4x | 31.7% | 2.1x | 7.1% | |
| Average | $16,077.40 | $1,662.80 | $17,887.90 | $6,709.00 | $926.40 | 2.0x | 16.9x | 33.6% | 2.2x | 11.1% |
Medical and Dental
| Company Name | Ticker | Market Cap | Net Debt | Enterprise Value | Revenue LTM | EBITDA LTM | EV / Revenue | EV / EBITDA | Gross Margin | Total Debt / EBITDA | EBITDA Margin |
|---|---|---|---|---|---|---|---|---|---|---|---|
| McKesson Corporation | NYS:MCK | $24,695.60 | $6,970.00 | $31,873.60 | $210,927.00 | $1,384.00 | 0.2x | 23.0x | 5.4% | 6.6x | 0.7% |
| AmerisourceBergen Corporation | NYS:ABC | 18,222.0 | 1,817.7 | 20,156.9 | 167,939.6 | 1,862.2 | 0.1x | 10.8x | 2.7% | 2.3x | 1.1% |
| Henry Schein, Inc. | NAS:HSIC | 13,338.3 | 2,037.9 | 16,102.3 | 13,144.8 | 1,019.8 | 1.2x | 15.8x | 27.3% | 2.1x | 7.8% |
| Patterson Companies, Inc. | NAS:PDCO | 2,192.5 | 653.1 | 2,849.3 | 5,516.9 | 231.6 | 0.5x | 12.3x | 21.1% | 3.5x | 4.2% |
| Owens & Minor, Inc. | NYS:OMI | 432.1 | 1,515.6 | 1,947.7 | 9,685.6 | -43.3 | 0.2x | nm | 13.6% | -37.9x | -0.4% |
| Median | $13,338.30 | $1,817.70 | $16,102.30 | $13,144.80 | $1,019.80 | 0.2x | 14.0x | 13.6% | 2.3x | 1.1% | |
| Average | $11,776.10 | $2,598.90 | $14,586.00 | $81,442.80 | $890.90 | 0.4x | 15.5x | 14.0% | -4.7x | 2.7% |
Power and Electrical
| Company Name | Ticker | Market Cap | Net Debt | Enterprise Value | Revenue LTM | EBITDA LTM | EV / Revenue | EV / EBITDA | Gross Margin | Total Debt / EBITDA | EBITDA Margin |
|---|---|---|---|---|---|---|---|---|---|---|---|
| Arrow Electronics, Inc. | NYS:ARW | $6,510.90 | $3,036.10 | $9,597.00 | $29,556.00 | $1,254.50 | 0.3x | 7.7x | 12.4% | 2.8x | 4.2% |
| Applied Industrial Technologies, Inc | NYS:AIT | 2,342.7 | 916.0 | 3,258.7 | 3,257.1 | 298.2 | 1.0x | 10.9x | 29.0% | 3.3x | 9.2% |
| WESCO International, Inc. | NYS:WCC | 2,388.7 | 1,149.1 | 3,532.3 | 8,161.8 | 408.3 | 0.4x | 8.7x | 19.1% | 3.2x | 5.0% |
| Anixter International | NYS: AXE | 2,010.3 | 1,193.8 | 3,204.1 | 8,294.9 | 367.9 | 0.4x | 8.7x | 19.6% | 3.4x | 4.4% |
| Richardson Electronics | NAS:RELL | 93.7 | -54.8 | 38.9 | 170.4 | 7.2 | 0.2x | 5.4x | 33.4% | 0.0x | 4.2% |
| Median | $2,342.70 | $1,149.10 | $3,258.70 | $8,161.80 | $367.90 | 0.4x | 8.7x | 19.6% | 3.2x | 4.4% | |
| Average | $2,669.20 | $1,248.00 | $3,926.20 | $9,888.00 | $467.20 | 0.5x | 8.3x | 22.7% | 2.5x | 5.4% |
Total across all sectors
| Market Cap | Net Debt | Enterprise Value | Revenue LTM | EBITDA LTM | EV / Revenue | EV / EBITDA | Gross Margin | Total Debt / EBITDA | EBITDA Margin | |
|---|---|---|---|---|---|---|---|---|---|---|
| Median | $2,515.00 | $1,164.00 | $4,772.10 | $8,161.80 | $397.00 | 0.6x | 12.5x | 24.1% | 3.1x | 5.7% |
| Average | $8,122.10 | $1,828.80 | $10,027.60 | $18,268.40 | $731.50 | 1.0x | 15.9x | 24.2% | 4.7x | 7.5% |
