Consumer M&A Trends: 2025 Q1-Q3 In Review
Published February 16, 2026

Meridian Capital’s 2025 Consumer M&A Market Monitor (Q1–Q3) highlights a sector navigating near-term pressure while positioning for recovery.
Transaction volume declined 14.7% year-over-year to 1,920 deals, reflecting cautious buyer sentiment amid persistent inflation and elevated interest rates. However, underlying fundamentals are stabilizing. Strategic buyers accounted for more than half of completed transactions, and premium, differentiated brands continued to command strong valuations, signaling selective but sustained demand for quality assets. As companies pivot toward profitability, operational efficiency, and disciplined growth, significant dry powder and improving consumer sentiment are expected to support a gradual rebound in M&A activity heading into 2026.
The full report provides detailed transaction data, valuation benchmarks, macroeconomic context, and subsector-specific insights designed to help founders, executives, and investors assess timing, positioning, and strategic options in the evolving consumer landscape
Key Insights
- Industry Trends & Benchmarking
- Q1-Q3 Consumer M&A Activity
- Consumer Subsector Spotlights
Perspective on 2025 Activity
As we review the first three quarters of 2025, the consumer sector tells a story of resilience amid persistent headwinds. While transaction volume declined 14.7% compared to the same period in 2024 with only 1,920 completed deals, improvement in some of the underlying fundamentals point to a market preparing for recovery.
Consumer confidence continued a downward trajectory, with inflationary pressures over the past three years forcing a fundamental shift in spending behavior. Many companies have tried to hold off from major price increases, instead focusing aggressively on operational efficiency and cost optimization, primarily through efforts in the supply chain and changes in personnel. This resulted in a median revenue growth of just 0.7% YoY and EBITDA growth of 1.6%.
The sector’s response has been varied, but decisive. We observed companies prioritizing profitable growth over pure revenue expansion, with smaller players doubling down on direct-to-consumer ecommerce channels for higher margins and faster customer feedback loops. Inventory rationalization and cash management became critical as businesses adapted to the persistent high-interest rate environment.
Strategic buyers represented 51.8% of transactions, demonstrating opportunistic appetite for quality assets at attractive valuations. Notable transactions like E.L.F. Beauty’s $800M acquisition of Rhode and Kontoor Brands’s $900M purchase of Helly Hansen signal premium brands with differentiated positioning continue to command strong valuations.
We anticipate Q4 2025 and 2026 will bring some ‘release of the pressure valve’ but not without obstacles. With significant dry powder waiting to be deployed and consumer sentiment projected to improve as inflationary pressures ease, the stage is set for more normalized levels of M&A activity. A potentially more relaxed regulatory environment could further catalyze larger strategic transactions.
This market plays to CLA Meridian Capital’s Consumer team’s strengths as we are experienced in advising companies throughout macroeconomic fluctuations to optimize for maximum value from an M&A process. Our team remains available to help evaluate strategic opportunities to take advantage of these unique market conditions.

Consumer Team Lead
Benton Sturt
CLA Meridian Capital’s Consumer Practice
Overview
CLA Meridian Capital’s Consumer practice has been a core focus area of the firm since its founding in 1995. Our knowledge and appreciation for the sector is a key pillar of the practice and continues to benefit our clients today.
Our Consumer team possesses deep industry relationships with leading consumer founders, operators and investors, and is up-to-date on the latest sector trends and considerations.
CLA Meridian Capital is pleased to present its Consumer M&A Market Monitor for Q3 2025.
01. Industry Trends & Benchmarking
Consumer Market Overview
2025 Q1-Q3 Public Market Statistics
0.7%
Median Revenue Growth Yo Y
1.6%
Median Ebitda Growth Yo Y
9.1%
Median Projected 2026 Revenue Growth
2025 Q1-Q3 Transaction Statistics
1,920
M&a Deals Completed
$135 B
Total M&a Deal Value Disclosed
$36 B
Total Vc / Pe Growth Capital Raised
-14.7%
M&a Deals Completed
1.0x
Median Ev / Revenue Multiple
51.8%
Strategic Buyers
$22 M
Median Deal Value (disclosed)
6.3x
Median Ev / Ebitda Multiple
48.2%
Financial Buyers
Arrows represent directional movement compared to prior period
Consumer Macroeconomic Trends
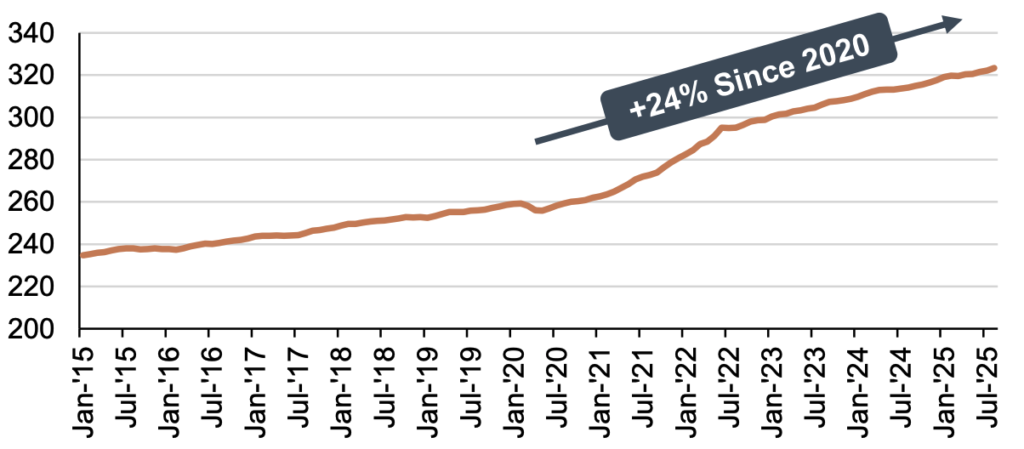
Consumer Confidence Index (Long-Term Average = 100)

Consumer confidence remains near 3-year lows through Q3 2025 as consumers remain cautious on spending
Monthly Consumer Price Index
Rapidly increasing consumer prices over the last 5 years have pushed many consumers to focus on staples and necessities
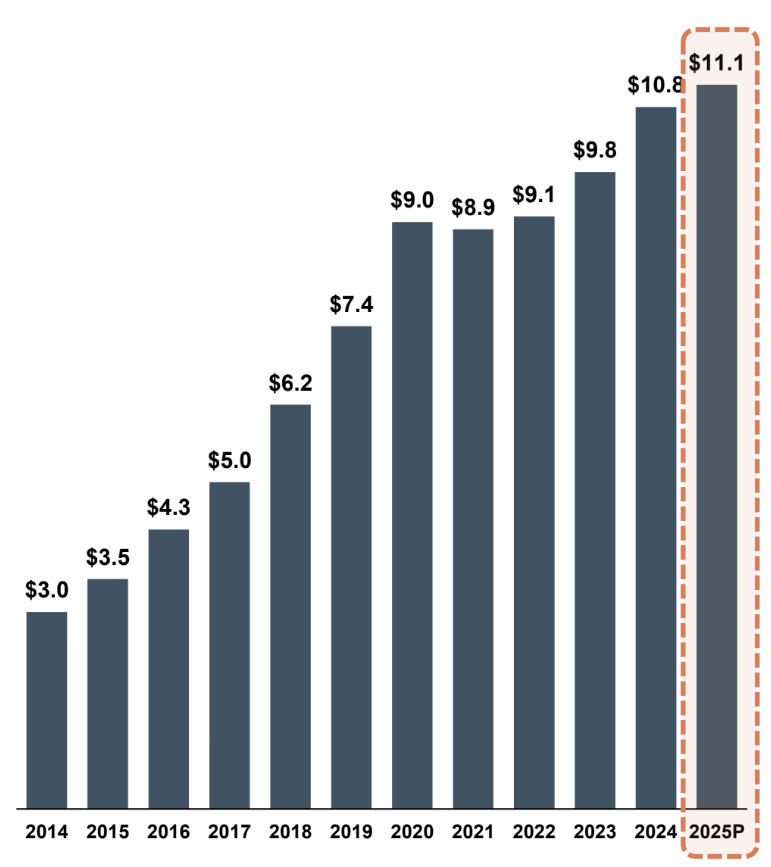
TTM U.S. Personal Consumption Expenditure ($T)
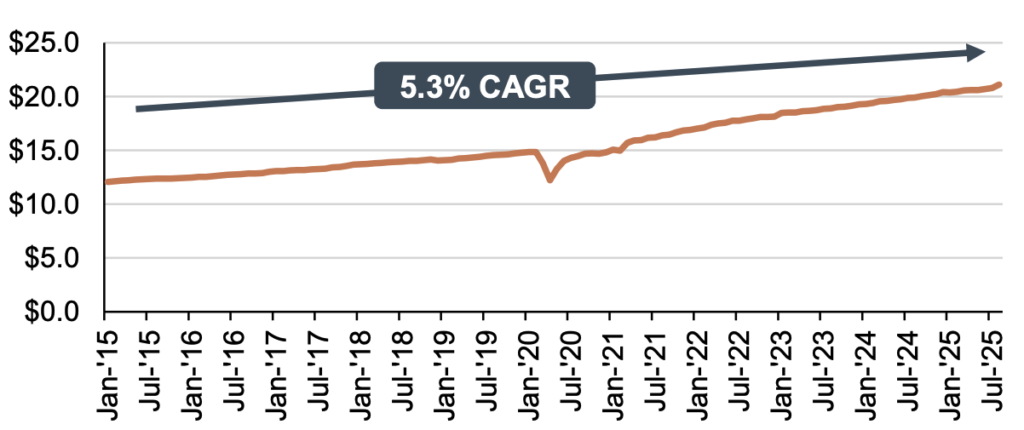
U.S. personal consumption expenditures continue to rise, nearly doubling over the last 10 years
Monthly U.S. Total Retail Sales ($B)
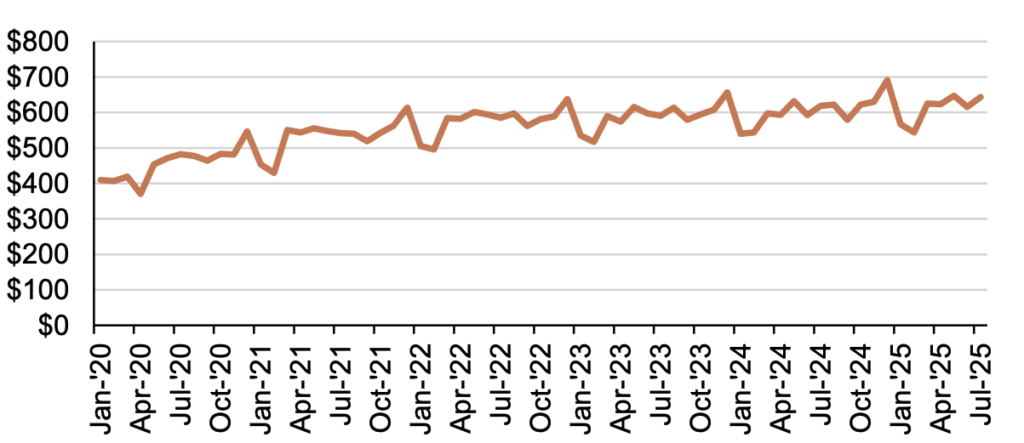
Monthly total retail sales have remained consistent over the last 3 years around $600B; increases expected from tariff and inflationary pressures
Source: FRED, OECD, Census
Consumer Industry 2025 Q1-Q3 in Review
Stabilizing Inventory Levels and Cash Management
Companies continued to focus on stabilizing inventory levels and correcting oversupplies or shortages caused by ongoing supply chain disruptions. In parallel, cash flow and prudent financing remains a main area of focus given the persistent high-interest rate environment
Magnification of the Fundamentals
After years of relying on price increases to offset inflation, many companies have started bumping up against price ceilings, forcing a much more targeted focus on cost optimization, operational efficiencies, digital and A.I.-supported enhancements, and mining existing customers for growth
Navigating the A.I. Rush
While still early innings, utilization of A.I. tools is quickly becoming a new key differentiator, allowing brands to unlock efficiencies and provide the hyper-personalized experiences that consumers are increasingly expecting
Continued Income-Based Market Bifurcation
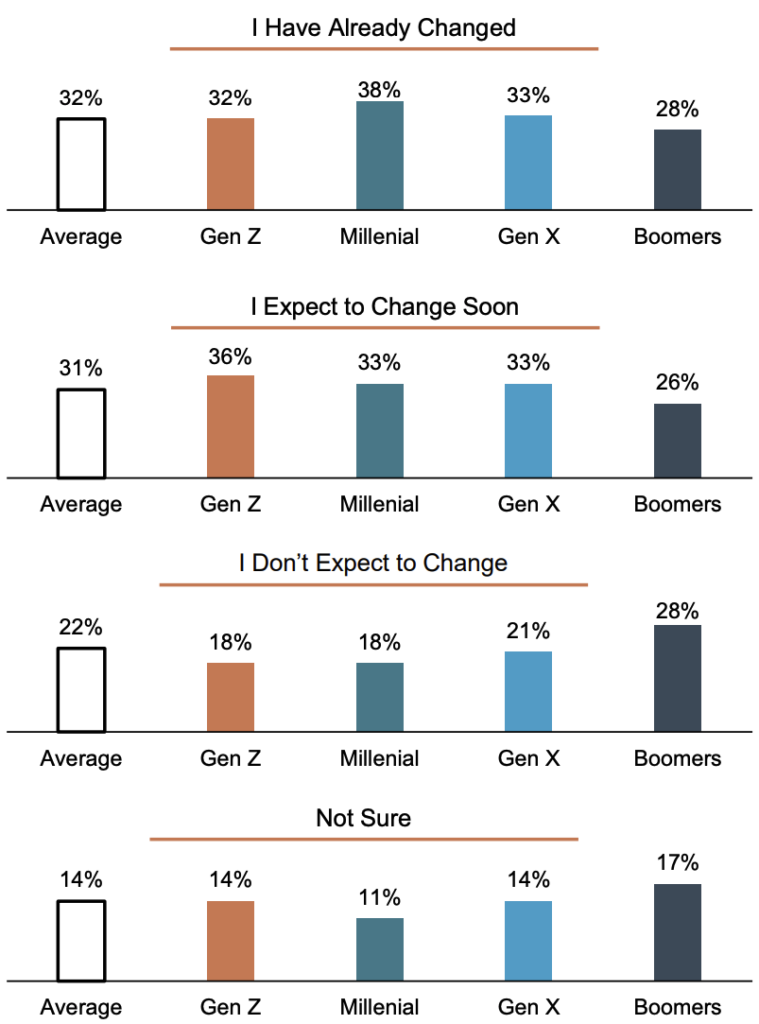
A clear bifurcation in consumer spending remains evident, as higher-income households maintain spending on premium goods while cost-pressured, lower-income segments are increasingly focusing spend on essentials and non-discretionary
Changes in Consumer Spending Habits Due to Tariff News
Source: U.S. Bureau of Labor Statistics, McKinsey
2025 Holiday Season Outlook
Black Friday surpassed expectations in 2024, with revenue, order volume, and advertising spend exceeding projected
levels. In 2025, growth trends are expected to level off as consumers remain price conscious and discretionary spending
is tightened.
- Many consumers are concerned about how ongoing tariff volatility will impact prices, especially during high-volume sales times. Popular, discounted items may sell out faster than normal
- 54% of shoppers report they plan to use AI tools to help with their holiday shopping to assist with comparing prices, searching for deals, and getting product recommendations
- Holiday shoppers will be more intentional than impulsive, using multiple channels to research before purchasing. Brands can’t rely on single sales touchpoints anymore and must deliver seamless experiences anywhere their audiences spend time
Black Friday Ecommerce Sales ($B)
Estimates project 2-4% growth in total sales from 2024 to 2025, a sharp decrease to the 10-year CAGR of 13.1%
Source: SGB Media, Digital Commerce 360, Experian, Black Friday
Consumer Subsector Benchmarking
2-Yr Revenue CAGR, EBITDA Margin, and EV Size – All Consumer Public Companies
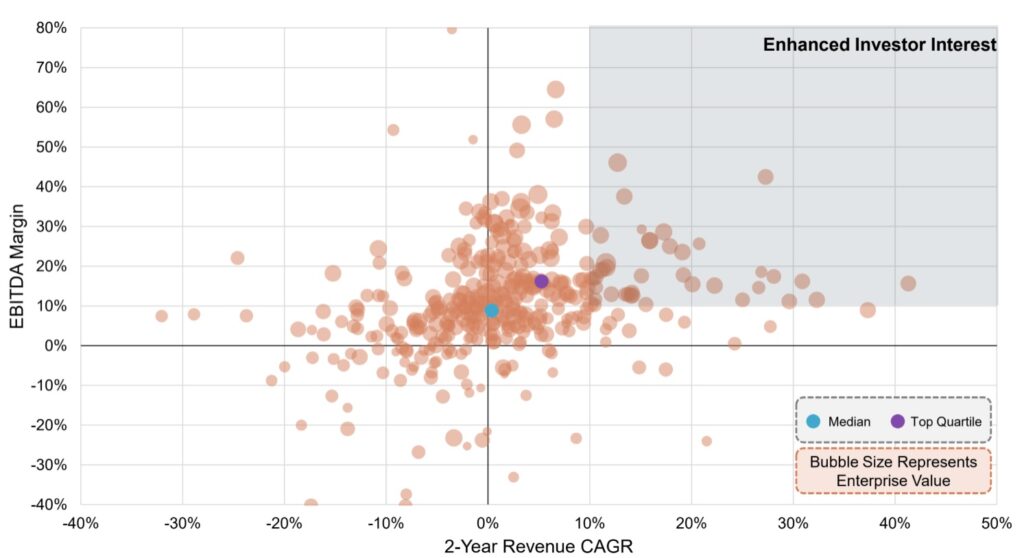
Source: Pitchbook as of 10/1/25, CLA Meridian Capital Proprietary Private Database; Includes Public Companies
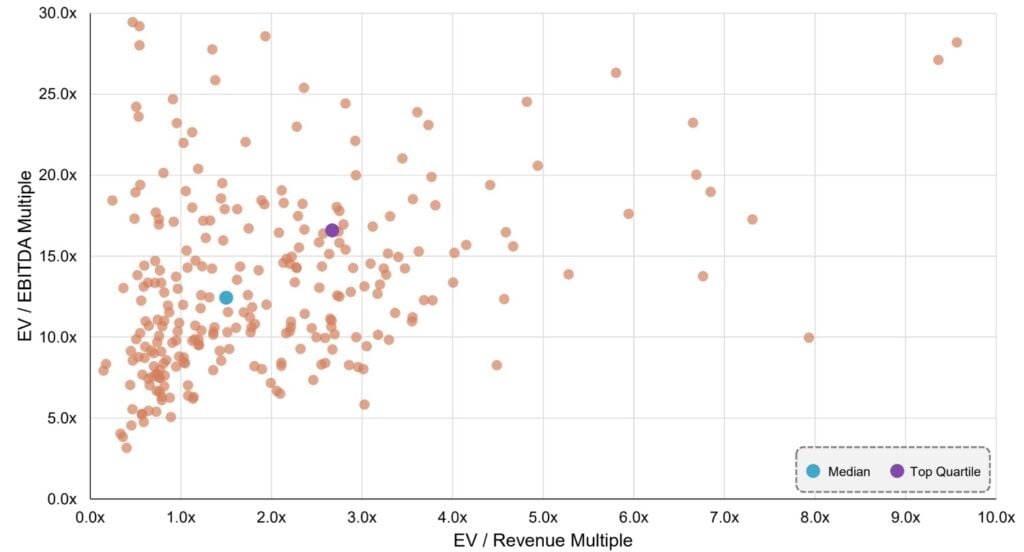
EBITDA and Revenue Multiples – All Consumer Public Companies
Revenue Growth YoY & EBITDA Margin – All Consumer Subsectors
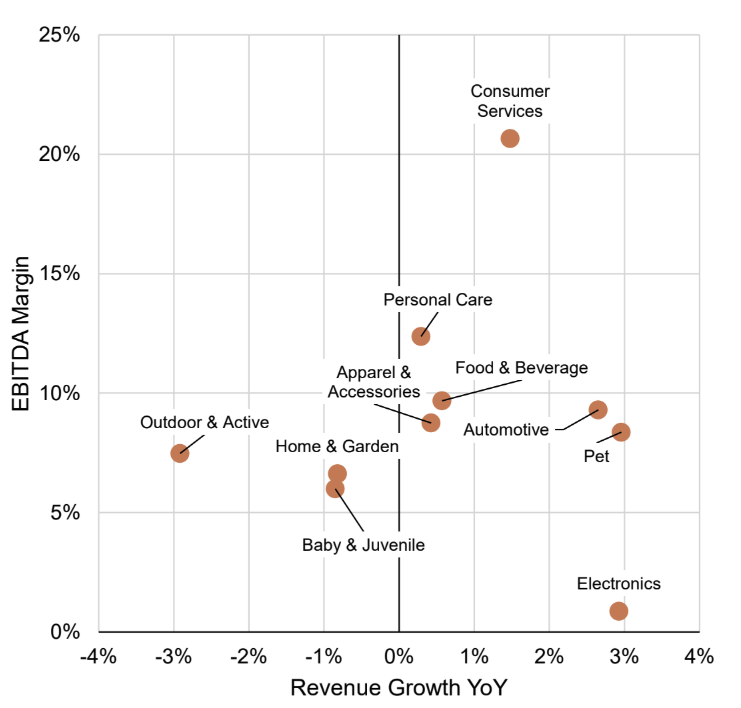
The majority of consumer subsectors are experiencing tightening growth rates and margin profiles given recent macro pressures
Revenue Growth YoY & EBITDA Margin – All Consumer Subsectors
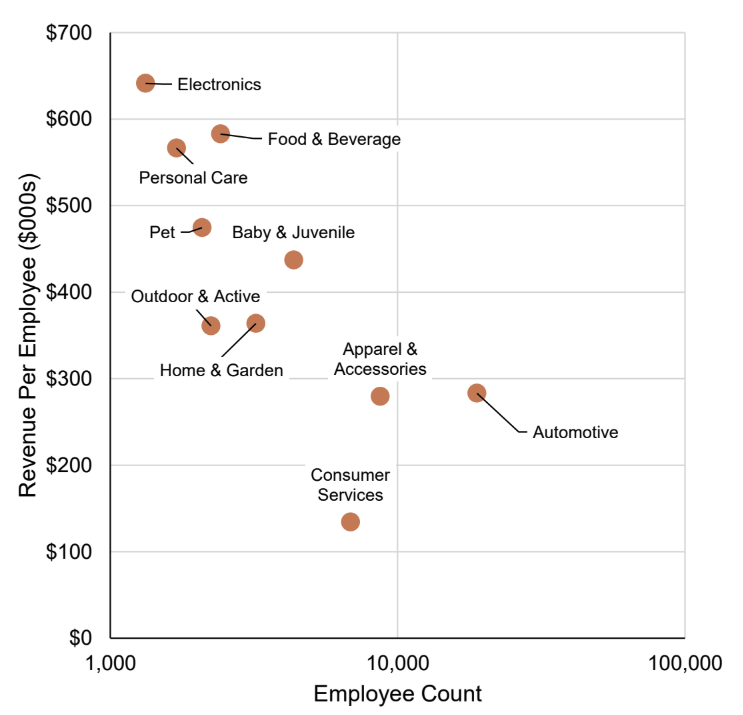
Revenue per employee has become an increasingly important metric as personnel costs have continued to rise, top performers target $500k+ with highly efficient models exceeding $1M+ per employee
Source: Pitchbook as of 10/1/25, CLA Meridian Capital Proprietary Private Database; Includes Public Companies
02. Q1-Q3 2025 Consumer M&A Activity
Looking Back on Q1-Q3 ’25
Overall global M&A activity was muted in Q1-Q3 as many companies continue to wait for favorable market conditions before transacting
M&A activity was constrained by persistent high borrowing costs and general economic uncertainties, which led many potential market participants to remain on the sidelines
Consumers demonstrated continued hesitation to discretionary spending in Q1-Q3 ’25, primarily driven by easing inflationary pressures showed signs of easing and elevated interest rates
Value-oriented and staple products continued to outperform discretionary and trend-following segments, as consumers prioritized essential goods and services
Private equity have continued to hold assets longer than typical in 2025, delaying exits as they awaited favorable interest rate environments and rebounds in consumer confidence
Looking Forward to 2026
Consumer M&A activity is anticipated to show signs of recovery in 2026, building on a modest uptick observed in Q1 and Q2 2025
Investors remain poised to deploy significant dry powder in Q4’25 and 2026, strategically searching to bolster technology capabilities and acquire differentiated consumer brands
Consumer sentiment is projected to improve in the future, driven by an expected easing of inflationary pressures, more accessible borrowing costs, and a clearer economic outlook
The consumer sector will likely continue to face operational challenges from tariffs on imports from key trading partners like Canada, Mexico, and China impacting supply chains and costs.
A more relaxed Federal Trade Commission (FTC) could lessen regulatory fears and lean strategic buyers to entertain larger M&A strategies
Source: CLA Meridian Capital Research, PwC, BCG, Gemini
M&A Activity Update
M&A Commentary
- The first three quarters of 2025 represented a slower period for the consumer M&A sector as buyers continue to wait for valuations and market sentiment to return to normalized levels.
- The M&A activity that occurred in the first three quarters was largely focused on more recurring or stable-demand categories (e.g. CPG and Consumer Services) with focuses on add-on acquisitions to existing platforms and selective expansion.
- The M&A activity that occurred in the first three quarters was largely focused on more recurring or stable-demand categories (e.g. CPG and Consumer Services) with focuses on add-on acquisitions to existing platforms and selective expansion.
- Divestitures and carve-outs have contributed to M&A volume as businesses focus on core competencies and look to streamline operations as they navigate economic headwinds.
- Strategic buyers with healthy balance sheets have begun to opportunistically capitalize on softer valuations to consolidate markets and expand wallet share through acquisitions. This trend is expected to remain strong heading into 2026.
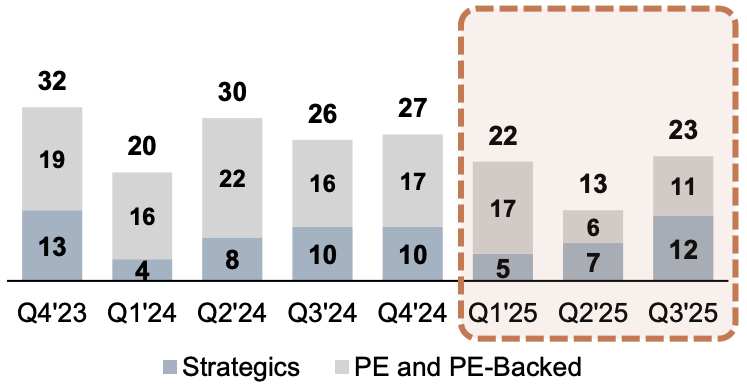
US Deal Count by Investor Type (2022-2025 Q3)
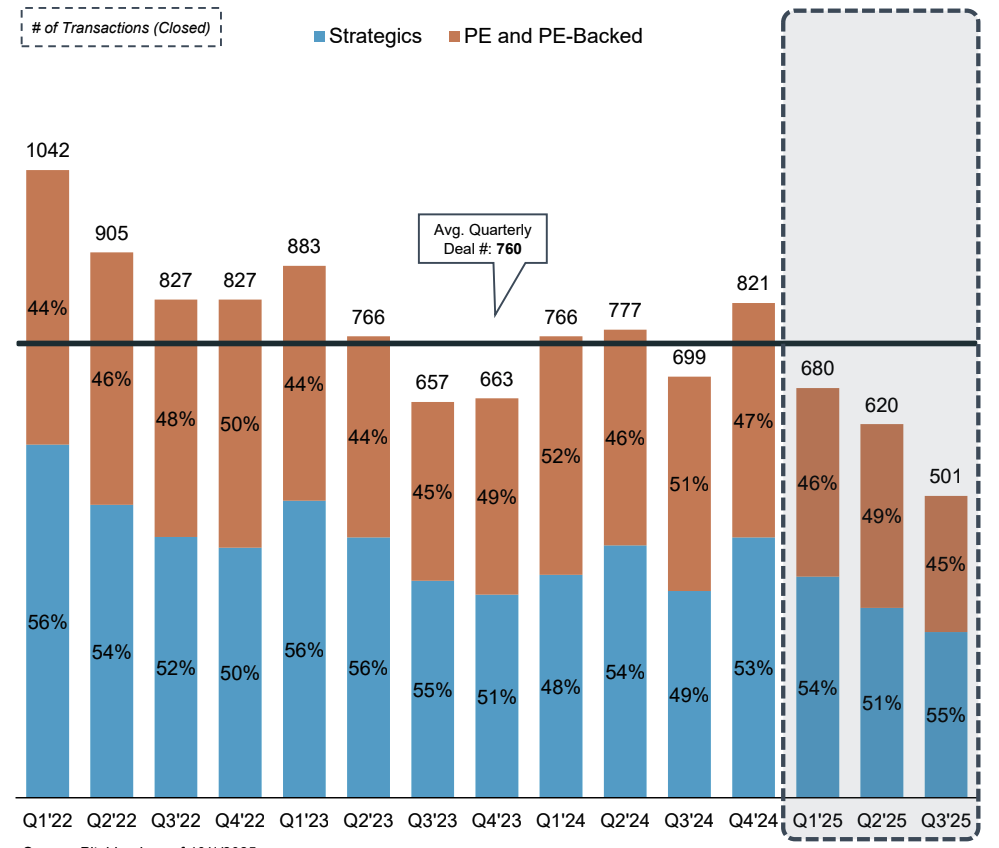
Source: Pitchbook as of 10/1/2025
Select M&A Transactions
| Date | Target | Acquirer | Target Description | Sector | EV | EV / Rev | EV / EBITDA |
|---|---|---|---|---|---|---|---|
| Sep-25 | Oil Changers | Valvoline | Chain of oil changing service centers | Automotive | $630 | – | – |
| Sep-25 | WK Kellogg | Ferrero International | Cereal manufacturer | Food & Beverage | $3,100 | 1.2x | 20.4x |
| Sep-25 | Skechers USA | 3G Capital | Lifestyle footwear brand | Apparel & Accessories | $9,400 | 1.0x | 8.7x |
| Sep-25 | Foot Locker | Dick’s Sporting Goods | Footwear and apparel retailer | Apparel & Accessories | $5,184 | 0.7x | – |
| Aug-25 | Irwin Naturals | FitLife Brands | Manufacturer of dietary supplements | Supplements | $43 | 0.6x | 5.4x |
| Aug-25 | Philz Coffee | Freeman Spogli | Operator of a coffee chain | Restaurant | $145 | – | – |
| Aug-25 | Rhode | E.L.F. Beauty | Provider of personal care and skincare products | Personal Care | $800 | 3.8x | – |
| Aug-25 | Stuart Weitzman | Caleres | Manufacturer of luxury accessories and footwear | Apparel & Accessories | $120 | 0.5x | – |
| Jul-25 | Touchland | Church & Dwight | Provider of self-care products | Personal Care | $950 | 7.3x | 17.3x |
| Jul-25 | Family Dollar Stores | Dollar Tree | Retail variety stores | Retail | $1,000 | – | – |
| Jun-25 | Medik8 | L’Oreal | Provider of cosmetics and personal care products | Personal Care | $1,100 | 9.6x | 28.2x |
| Jun-25 | Chef Boyardee | Hometown Food Company | Producer of packaged pasta meal items | Food & Beverage | $601 | – | – |
| Jun-25 | Helly Hansen | Kontoor Brands | Manufacturer of outdoor and active apparel | Outdoor & Active | $900 | 2.7x | 19.9x |
| May-25 | Dave’s Hot Chicken | Roark Capital Group | Restaurant chain serving fried chicken | Restaurant | $1,000 | 0.8x | – |
| May-25 | Nordstrom | El Puerto de Liverpool | Retailer of apparel, accessories, and other items | Apparel & Accessories | $10,533 | 0.7x | 8.2x |
| Date | Target | Acquirer | Target Description | Sector | EV | EV / Rev | EV / EBITDA |
|---|---|---|---|---|---|---|---|
| May-25 | Poppi | Pepsico | Producer of prebiotic soda | Food & Beverage | $1,950 | 3.9x | – |
| Apr-25 | Harvest Hill Beverage | Centerview Capital | Manufacturer and distributor of beverages | Food & Beverage | $1,500 | – | – |
| Apr-25 | The Vitamin Shoppe | Kingswood Capital Management | Retailer of supplements | Supplements | $195 | – | – |
| Apr-25 | LesserEvil | The Hershey Company | Producer of snack food products | Food & Beverage | $750 | 4.6x | – |
| Apr-25 | Alani Nu | Celsius Holdings | Producer of energy drinks and other supplements | Supplements | $1,800 | 3.0x | 13.1x |
| Apr-25 | Wheeler Fleet Solutions | One Equity Partners | Distributor of truck parts and other automotive parts | Automotive | $255 | 7.3x | – |
| Apr-25 | VOXX International | Gentex | Manufacturer and distributor of consumer electronics | Electronics | $218 | 0.5x | – |
| Mar-25 | Samauma Brands | Telefónica | Distributor of consumer electronics | Electronics | $14 | 1.1x | – |
| Feb-25 | Simple Mills | Flowers Foods | Producer of gluten free and other food products | Food & Beverage | $795 | 3.3x | – |
| Feb-25 | Mattress Firm | Somnigroup International | Retailer of mattresses and other home items | Furniture & Homegoods | $4,000 | – | – |
| Jan-25 | BioNutritional Research Group | Ferrero International | Producer of protein-based food products | Supplements | $275 | 4.8x | – |
| Jan-25 | Siete Family Foods | Pepsico | Producer of grain-free food products | Food & Beverage | $1,200 | 2.4x | – |
| Jan-25 | Spindrift Beverage Co. | Gryphon Investors | Producer of sparking water beverages | Food & Beverage | $650 | – | – |
| Jan-25 | Big Lots | Gordon Brothers | Operator of discount retail stores | Retail | – | – | – |
| Jan-25 | QSC (Electronics) | Acuity | Manufacturer of consumer audio electronics | Electronics | $1,215 | 2.3x | – |
Source: Pitchbook and MergerMarket as of 10/1/2025; CLA Meridian Capital Research
03. Consumer Subsector Spotlights
Automotive Industry Trends
Sector Trends
- The increasing average age of the global vehicle fleet, driven largely by rising new car prices, assures sustained demand for traditional replacement parts, aftermarket parts, and essential maintenance services
- High margin, fragmented industries like car washes and service/repair centers saw significant consolidation efforts from a number of large platforms
- Adoption of EVs mandates a strategic pivot for service providers, requiring investment in new tools and training for the growing sector
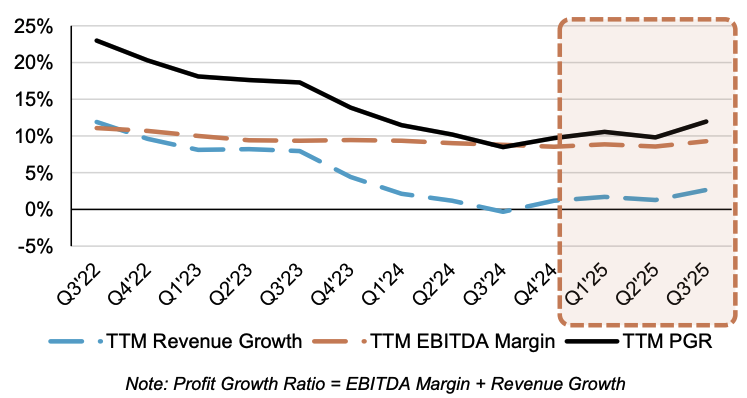
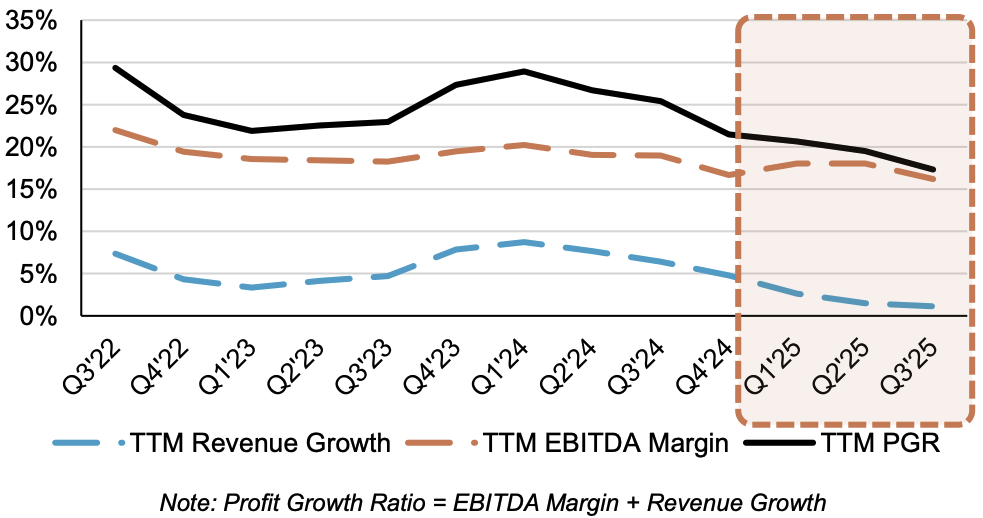
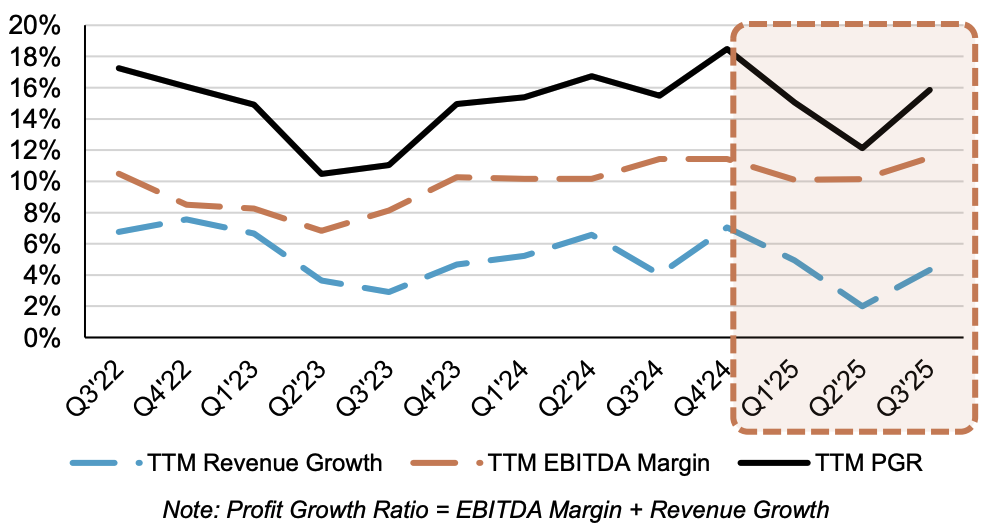
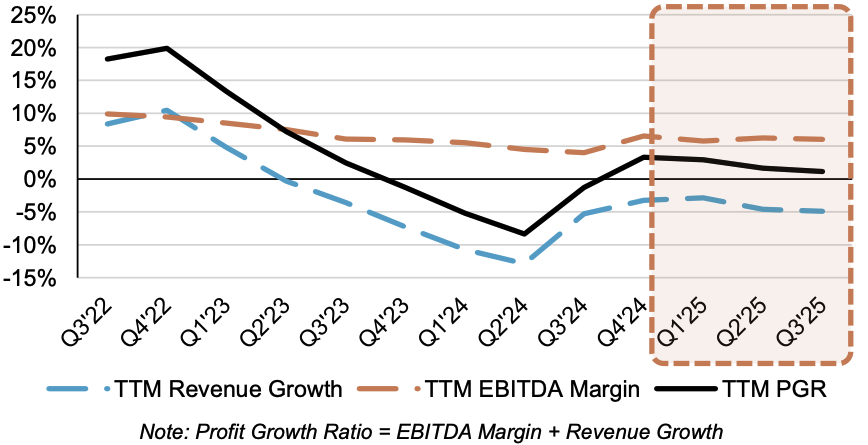
Profit Growth Ratio (PGR) – Public Companies
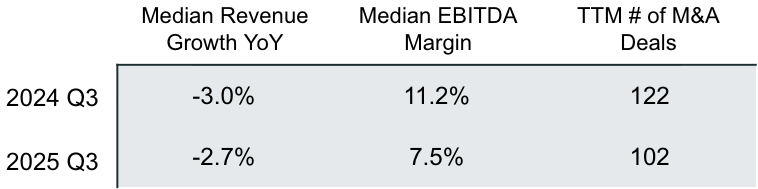
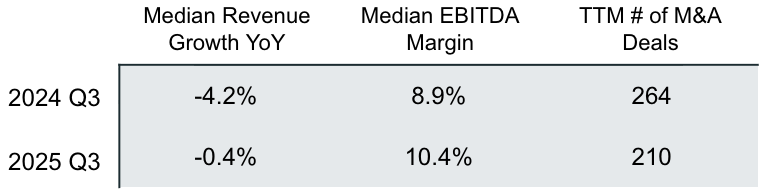
M&A Activity Overview
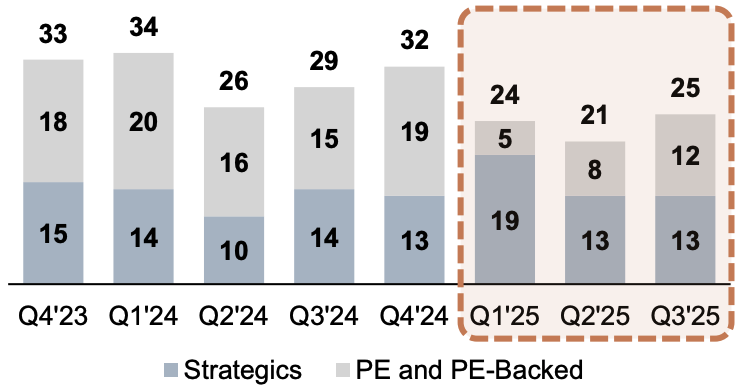
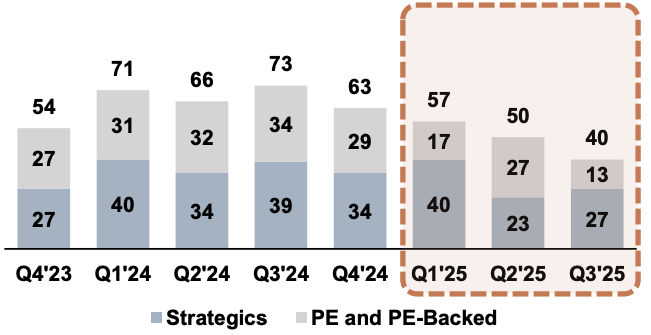
Breakdown of M&A Deals by Quarter
Select Transactions
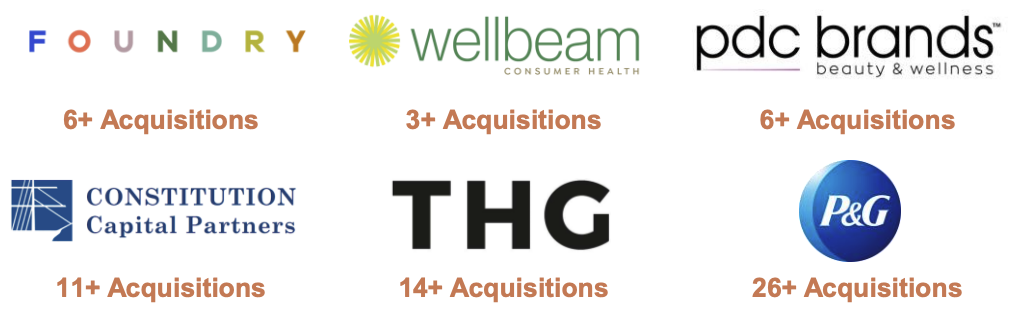
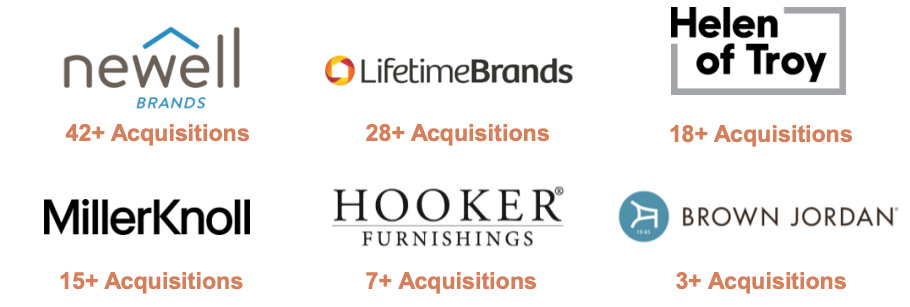
Highly Acquisitive Players

Personal Care & Beauty Industry Trends
Sector Trends
- The increasing average age of the global vehicle fleet, driven largely by rising new car prices, assures sustained demand for traditional replacement parts, aftermarket parts, and essential maintenance services
- High margin, fragmented industries like car washes and service/repair centers saw significant consolidation efforts from a number of large platforms
- Adoption of EVs mandates a strategic pivot for service providers, requiring investment in new tools and training for the growing sector

Profit Growth Ratio (PGR) – Public Companies
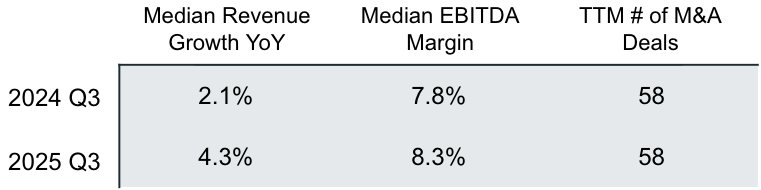
M&A Activity Overview
Breakdown of M&A Deals by Quarter

Select Transactions
Highly Acquisitive Players
Supplements & Nutrition Industry Trends
Sector Trends
- Consumers are moving away from generic, one-size-fits-all supplements towards personalized, customized regimens
- With increasing awareness of mental health, a new, highly accessible category of supplements is emerging that is focused on cognitive and emotional well-being
- Protein continues to expand beyond its traditional athlete nutrition audience to become a dominant, multi-purpose ingredient for all-day health and convenience
Profit Growth Ratio (PGR) – Public Companies
M&A Activity Overview
Breakdown of M&A Deals by Quarter

Select Transactions
Highly Acquisitive Players

Outdoor & Active Industry Trends
Sector Trends
- Consumers continue to seek calm and happiness outdoors, beginning with gateway activities like hiking, camping, and fishing
- The outdoors are increasingly viewed as a tool for social connection and building community. Brands are focusing on cultivating online and real-world communities through loyalty programs and ambassador programs to build lasting consumer loyalty
- Technology is moving into physical gear, driving rapid growth in smart electronic devices for outdoor use and high-performance wearables
Profit Growth Ratio (PGR) – Public Companies

M&A Activity Overview
Breakdown of M&A Deals by Quarter
Select Transactions
Highly Acquisitive Players

Home & Garden Industry Trends
Sector Trends
- Market growth was sluggish and revised downward due to high interest rates and inflation as shoppers exhibited more disciplined purchasing characterized by longer research periods and a focus on affordability
- Consumers have continued to pursue a “stay-and-renovate” mentality, prioritizing upgrades that enhance well-being and home functionality
- The pandemic pushed the outdoor space to become a critical, year-round “room”, leading to increased investment in premium, durable outdoor furniture and other high-performance products
Profit Growth Ratio (PGR) – Public Companies
M&A Activity Overview
Breakdown of M&A Deals by Quarter
Select Transactions
Highly Acquisitive Players
Public Company Sub-Sector Valuation Metrics
Automotive
| Company | Market Cap | Market EV | LTM Rev | LTM EBITDA | EV/LTM Rev | EV/LTM EBITDA | LTM EBITDA Margin | 52-Week Change |
|---|---|---|---|---|---|---|---|---|
| O’Reilly Automotive Stores | 89,669 | 97,171 | 17,163 | 3,783 | 5.7x | 25.7x | 22.0% | 40.0% |
| AutoZone (Specialty Retail) | 70,792 | 82,777 | 18,901 | 4,302 | 4.4x | 19.2x | 22.8% | 39.1% |
| Genuine Parts | 19,218 | 24,419 | 23,771 | 1,646 | 1.0x | 14.8x | 6.9% | -0.1% |
| LKQ | 8,010 | 13,667 | 13,512 | 1,622 | 1.0x | 8.4x | 12.0% | -20.9% |
| Yokohama Rubber | 5,821 | 9,233 | 7,670 | 1,251 | 1.2x | 7.4x | 16.3% | 63.4% |
| Lear | 5,387 | 7,419 | 17,311 | 1,264 | 0.4x | 5.9x | 7.3% | -6.4% |
| Advance Auto Parts | 3,713 | 7,399 | 8,737 | (581) | 0.8x | NM | -6.6% | 65.2% |
| Dorman Products | 4,738 | 5,241 | 2,086 | 391 | 2.5x | 13.4x | 18.7% | 39.6% |
| Atmus Filtration Technologies | 3,655 | 4,088 | 1,352 | 302 | 3.0x | 13.5x | 22.4% | 19.7% |
| Garrett Motion | 2,770 | 4,061 | 3,430 | 571 | 1.2x | 7.1x | 16.6% | 70.5% |
| Phinia | 2,232 | 2,928 | 3,358 | 436 | 0.9x | 6.7x | 13.0% | 24.3% |
| ARB Corporation | 2,131 | 2,116 | 472 | 110 | 4.5x | 19.3x | 23.2% | -20.2% |
| Ridefox | 1,031 | 1,712 | 1,442 | (116) | 1.2x | NM | -8.0% | -39.8% |
| Standard Motor Products | 901 | 1,534 | 1,650 | 153 | 0.9x | 10.0x | 9.3% | 26.1% |
| Median | 4,226 | 6,320 | 5,550 | 504 | 1.2x | 11.7x | 14.6% | 25.2% |
| Mean | 15,719 | 18,840 | 8,633 | 1,081 | 2.1x | 12.6x | 12.6% | 21.4% |
Personal Care & Beauty
| Company | Market Cap | Market EV | LTM Rev | LTM EBITDA | EV/LTM Rev | EV/LTM EBITDA | LTM EBITDA Margin (%) | 52-Week Change (%) |
|---|---|---|---|---|---|---|---|---|
| L’Oreal | 230,496 | 236,946 | 47,624 | 11,424 | 5.0 | 20.7 | 24.0% | -0.9% |
| Unilever | 144,963 | 143,743 | ND | 11,086 | ND | 13.0 | ND | -8.0% |
| Colgate-Palmolive | 63,858 | 71,603 | 19,999 | 4,743 | 3.6 | 15.1 | 23.7% | -21.7% |
| Reckitt Benckiser Group | 51,632 | 63,098 | 18,075 | 3,520 | 3.5 | 17.9 | 19.5% | 25.4% |
| The Estée Lauder Companies | 31,063 | 40,121 | 14,326 | 32 | 2.8 | NM | 0.2% | -9.3% |
| Kenvue | 30,417 | 38,091 | 15,141 | 2,958 | 2.5 | 12.9 | 19.5% | -30.0% |
| ULTA Beauty | 24,932 | 26,567 | 11,655 | 1,862 | 2.3 | 14.3 | 16.0% | 46.2% |
| Beiersdorf | 22,978 | 23,175 | 10,715 | 1,735 | 2.2 | 13.4 | 16.2% | -30.6% |
| E.L.F. Beauty | 7,671 | 7,976 | 1,343 | 210 | 5.9 | 38.0 | 15.6% | 25.4% |
| Coty | 3,469 | 7,647 | 5,893 | 286 | 1.3 | 26.8 | 4.8% | -55.6% |
| Prestige Consumer Healthcare | 3,118 | 4,021 | 1,119 | 362 | 3.6 | 11.1 | 32.3% | -9.5% |
| Edgewell Personal Care | 970 | 2,183 | 2,204 | 245 | 1.0 | 8.9 | 11.1% | -40.3% |
| Median | 27,675 | 32,329 | 11,655 | 1,798 | 2.8 | 14.3 | 16.2% | -9.4% |
| Mean | 51,297 | 55,431 | 13,463 | 3,205 | 3.1 | 17.5 | 16.6% | -9.1% |
Supplements & Nutrition
| Company | Market Cap | Market EV | LTM Rev | LTM EBITDA | EV/LTM Rev | EV/LTM EBITDA | LTM EBITDA Margin (%) | 52-Week Change (%) |
|---|---|---|---|---|---|---|---|---|
| Monster Beverage | 65,841 | 63,768 | 7,659 | 2,091 | 8.3 | 30.5 | 27.3% | 32.4% |
| Celsius Holdings | 14,823 | 15,895 | 1,666 | 192 | 9.5 | NM | 11.5% | 88.8% |
| BellRing Brands | 4,564 | 5,530 | 2,169 | 386 | 2.5 | 14.3 | 17.8% | -40.0% |
| Herbalife Nutrition | 885 | 2,916 | 4,929 | 610 | 0.6 | 4.8 | 12.4% | 25.8% |
| Simply Good Foods | 2,495 | 2,646 | 1,458 | 245 | 1.8 | 10.8 | 16.8% | -26.5% |
| The Hain Celestial Group | 141 | 866 | 1,560 | (418) | 0.6 | NM | -26.8% | -82.5% |
| Nu Skin Enterprises | 594 | 640 | 1,626 | 205 | 0.4 | 3.1 | 12.6% | 74.8% |
| USANA Health Sciences | 498 | 401 | 899 | 90 | 0.4 | 4.5 | 10.0% | -25.1% |
| Zevia | 187 | 146 | 158 | (15) | 0.9 | NM | -9.8% | 139.4% |
| Median | 885 | 2,646 | 1,626 | 205 | 0.9 | 7.8 | 12.4% | 25.8% |
| Mean | 10,003 | 10,312 | 2,458 | 376 | 2.8 | 11.3 | 8.0% | 20.8% |
Outdoor & Active
| Company | Market Cap | Market EV | LTM Rev | LTM EBITDA | EV/LTM Rev | EV/LTM EBITDA | LTM EBITDA Margin (%) | 52-Week Change (%) |
|---|---|---|---|---|---|---|---|---|
| Garmin | 49,121 | 46,682 | 6,758 | 1,934 | 6.9 | 24.1 | 28.6% | 48.3% |
| Olin | 2,937 | 6,028 | 6,663 | 686 | 0.9 | 8.8 | 10.3% | -45.5% |
| Academy Sports and Outdoors | 3,484 | 5,025 | 5,937 | 640 | 0.8 | 7.9 | 10.8% | -5.9% |
| Colt CZ Group | 2,122 | 2,913 | 1,024 | 178 | 2.8 | 16.3 | 17.4% | 33.4% |
| Cadre Holdings | 1,468 | 1,690 | 573 | 84 | 3.0 | 20.1 | 14.7% | -4.7% |
| Sturm, Ruger & Co. | 711 | 713 | 536 | 27 | 1.3 | 26.8 | 5.0% | 5.9% |
| Smith & Wesson Brands | 439 | 548 | 471 | 55 | 1.2 | 9.9 | 11.7% | -22.8% |
| Johnson Outdoors | 426 | 468 | 563 | (28) | 0.8 | NM | -5.0% | 13.9% |
| Sportsman’s Warehouse Holdings | 97 | 428 | 1,208 | 23 | 0.4 | 18.3 | 1.9% | 12.9% |
| American Outdoor Brands | 108 | 140 | 210 | 9 | 0.7 | 16.1 | 4.1% | -4.0% |
| Outdoors Online | 170 | 130 | 29 | (40) | 4.5 | NM | -139.5% | 6.6% |
| Median | 711 | 713 | 573 | 55 | 1.2 | 16.3 | 10.3% | 5.9% |
| Mean | 5,553 | 5,888 | 2,179 | 324 | 2.1 | 16.5 | -3.6% | 3.5% |
Home & Garden
| Company | Market Cap | Market EV | LTM Rev | LTM EBITDA | EV/LTM Rev | EV/LTM EBITDA | LTM EBITDA Margin (%) | 52-Week Change (%) |
|---|---|---|---|---|---|---|---|---|
| The Home Depot | 395,188 | 453,705 | 165,054 | 25,603 | 2.7 | 17.7 | 15.5% | -3.5% |
| Lowe’s Companies | 139,079 | 173,279 | 82,338 | 12,357 | 2.1 | 14.0 | 15.0% | -8.8% |
| Williams-Sonoma | 23,786 | 24,194 | 7,830 | 1,665 | 3.1 | 14.5 | 21.3% | 28.0% |
| Wayfair | 11,204 | 13,579 | 12,008 | 124 | 1.1 | NM | 1.0% | 62.9% |
| Floor & Decor | 7,889 | 9,435 | 4,600 | 509 | 2.1 | 18.5 | 11.1% | -39.0% |
| Fortune Brands Innovations | 6,361 | 9,122 | 4,496 | 834 | 2.0 | 10.9 | 18.5% | -39.5% |
| Restoration Hardware | 3,764 | 7,641 | 3,337 | 495 | 2.3 | 15.4 | 14.8% | -40.0% |
| Newell Brands | 2,188 | 7,603 | 7,397 | 346 | 1.0 | 22.0 | 4.7% | -30.4% |
| MillerKnoll | 1,197 | 2,921 | 3,767 | 220 | 0.8 | 13.3 | 5.8% | -27.7% |
| HNI | 2,134 | 2,684 | 2,582 | 322 | 1.0 | 8.3 | 12.5% | -12.0% |
| Arhaus | 1,499 | 1,955 | 1,336 | 176 | 1.5 | 11.1 | 13.2% | -2.9% |
| La-Z-Boy | 1,394 | 1,805 | 2,106 | 243 | 0.9 | 7.4 | 11.5% | -17.5% |
| Median | 5,062 | 8,382 | 4,548 | 420 | 1.7 | 14.0 | 12.8% | -14.7% |
| Mean | 49,640 | 58,994 | 24,738 | 3,574 | 1.7 | 13.9 | 12.1% | -10.9% |
($US in millions) Market LTM Margin 52-Week
As of 10/1/2025
Source: Pitchbook as of 10/1/2025; CLA Meridian Capital Research
Meridian Capital's Consumer Products Transaction Experience


*Note: Includes transactions completed by Meridian bankers while at previous firms