Business Services M&A Trends: Fall 2021
Published November 30, 2021

KEY INSIGHTS
- Temporary staffing across the United States was up 20% year-over-year in Q3 2021 compared to Q3 2020
- The annual contract value for a Business Process Outsourcing firm increased by 48% from the first half of 2020 compared to the first half of 2021
- The global managed services market was estimated to generate ~$150 billion in revenue in 2020 and is projected to reach $274 billion by 2026 (10% CAGR)
While business services deal volume started to cool off in the second half of the year, valuation multiples remain high when disclosed, supported by strong public market valuations given the industry’s resilience throughout the pandemic (see page 7 for public company trading multiples). Despite the recent slowdown in number of deals, the overall amount of invested capital remains high, indicating continued investor appetite for larger transactions.
Private equity activity remains high within business services and specifically in the highly fragmented MSP market. With the average MSP reporting a client base of 122 clients and a large proportion of recurring revenue, the MSP sector is highly attractive for private equity investors.
Business Services Market Insights
Labor Shortage Driving Demand for Staffing and HRO Services
- Booming labor markets have driven demand for all types of staffing services as employers are struggling to keep their businesses fully staffed:
- In a recent study performed by Staffing Industry Analyst, temporary staffing across the United States was up 20% year-over-year in Q3 2021 compared to Q3 2020. Professional occupations (IT, healthcare, finance, engineering, etc.) were up 32% for the same period.
- In a recent study performed by Staffing Industry Analyst, temporary staffing across the United States was up 20% year-over-year in Q3 2021 compared to Q3 2020. Professional occupations (IT, healthcare, finance, engineering, etc.) were up 32% for the same period.
- With increasing demand, staffing businesses will need to focus heavily on talent acquisition and client relationships to continue to provide quality candidates to their clients:
- In a recent COVID-19 impact survey targeting staffing business owners/operators performed by Bullhorn, 45% of respondents stated managing relationships is their highest priority, followed by engaging candidates (36%), and managing cash/controlling expenses (34%).
Business Process Outsourcing on the Rise as Cost Pressures Mount
- As business operators struggle to manage their businesses during the pandemic, many of them look to business process outsourcing (“BPO”) to streamline operations, combat rising labor and raw material costs, and contest increasingly competitive pricing:
- A market study completed by ISG showed the annual contract value for a BPO increased by 48% from the first half of 2020 to the first half of 2021. This contract growth is being attributed to the disruption in working conditions and changing consumer behavior.
- A market study completed by ISG showed the annual contract value for a BPO increased by 48% from the first half of 2020 to the first half of 2021. This contract growth is being attributed to the disruption in working conditions and changing consumer behavior.
- A recent study performed by Technavio estimates the global BPO industry will have a compound annual growth rate (“CAGR”) of 7% for 2020 – 2024. Of this growth, the IT and telecommunications segment is expected to hold the highest market share as the pandemic has forced many companies to undergo significant digital transformation.
Increased Digitization Requires Service Providers with Wide-Ranging Expertise
- Companies are finding it increasingly difficult to navigate the complexity and breadth of today’s digital environment, with many aspects of an organization’s IT strategy often being interconnected. A recent survey of more than 500 IT leaders and executives ranked both cyber security and data modernization as the top two reasons for migrating their data and applications to the cloud.
- Furthermore, COVID-19 has exposed gaps in many businesses’ digital capabilities, with a large portion of business executives re-evaluating their timeline and approach to new transformative technology projects.
- In a recent survey by CompTIA, 67% of respondents mentioned they are likely to seek third-party assistance for remote work capabilities due to the pandemic.
- In a recent survey by CompTIA, 67% of respondents mentioned they are likely to seek third-party assistance for remote work capabilities due to the pandemic.
- These trends have driven a surge in M&A activity amongst IT consulting firms and managed services providers (“MSPs”), as companies look for ways to expand their suite of solutions and offer customers a one-stop-shop for all their IT needs. For a diversified IT services firm, initial projects such as cloud migration can often open the door for other product offerings, including ongoing managed services (see pages 3 and 4 for our MSP spotlight).
Source: Deloitte Insights, Mordor Intelligence, Technavio, ISG Analytics, Staffing Industry Analyst, Bullhorn.
MSP Spotlight
PE-backed Roll-Ups Consolidating the Highly Fragmented MSP Market
- MSPs are third-party service providers that manage an organization’s day-to-day functions, including hosting, security, networking, and communications, hardware support, etc. This allows companies to focus on their core business while outsourcing other tasks to service providers who have the requisite operational expertise.
- The global managed services market was estimated to generate ~$150 billion in revenue in 2020 and is projected to reach $274 billion by 2026 (10% CAGR).
- The market is highly fragmented, with the average MSP reporting a client base of 122 clients, and the large proportion of recurring revenue makes the MSP sector highly attractive for private equity.
- Given the level of interest from private equity, as well as from strategics who are interested in diversifying their suite of IT solutions, MSP M&A activity is expected to remain robust for the foreseeable future.
NexusTek (Backed by Abry Partners)

Headquarters: Greenwood Village, CO
Platform Date: 2017
Acquisitions: 7 acquisitions since 2017
Description: NexusTek is a national managed IT services provider offering end-user services, cloud, infrastructure, cyber security, and IT consulting.
Investment Strategy: Nationwide provider of managed services to businesses of all sizes, operating out of five network operation centers across the country to offer 24/7/365 support.
Evergreen Services Group (Backed by Alpine Investors)

Headquarters: San Francisco, CA
Platform Date: 2017
Acquisitions: 13 Acquisitions since 2017
Description: Evergreen Services Group is a family of leading managed IT services providers. Investment Strategy: Evergreen partners with founders to provide operational assistance and capital in support of growth over a long-term hold period, with a focus on companies with expertise in managed IT services, government services, and application management.

Ntiva (Backed by Southfield)

Headquarters: Mclean, VA
Platform Date: 2016
Acquisitions: 12 acquisitions since 2016
Description: Ntiva is a leading provider of managed IT services, strategic consulting, cloud services, and cyber-security solutions.
Investment Strategy: Through acquisitions, Ntiva has developed a broad geographic footprint with over 1,500 clients across the U.S., including Washington DC, Maryland, Virginia, Illinois, New York, the Rocky Mountains, and Southern California.
Source: PitchBook, Company Press Releases, Meridian Research , Mordor Intelligence
M&A Activity and Commentary
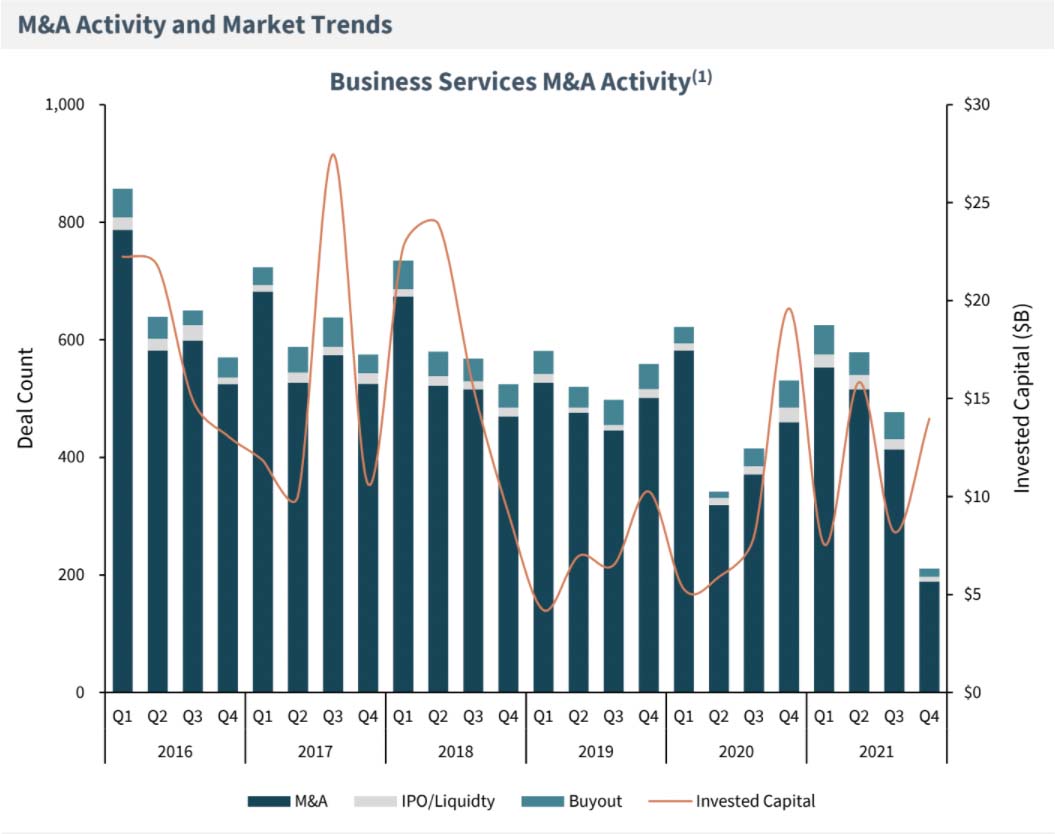
- Heightened M&A activity continued in 1H’21 as companies rushed to complete transactions before year-end ahead of potential tax changes under the Biden-Harris administration.
- Additionally, concerns around inflation have caused investors to question how much longer rates can remain low, prompting buyers to take advantage of cheap debt financing while it lasts.
- Within business services specifically, trends such as workplace digitalization, remote working capabilities, cloud integration, and outsourced services continued to drive transaction activity.
- While business services deal volume started to cool off in the second half of the year, valuation multiples remain high when disclosed, supported by strong public market valuations given the industry’s resilience throughout the pandemic (see page 7 for public company trading multiples). Despite the recent slowdown in number of deals, the overall amount of invested capital remains high, indicating continued investor appetite for larger transactions.
Source: PitchBook Data, Company Press Releases, and Meridian Research
(1) Q4 2021 is a partial period through November 9th, 2021
Select Recent Business Services Transactions
| Date | Buyer | Target | Target Description |
|---|---|---|---|
| Nov-21 | 3Cloud | CCG Analytics | Provider of business data and analytics services. |
| Oct-21 | Norwest Equity Partners | Coretelligent | Provider of comprehensive managed IT, cybersecurity, and cloud services. |
| Oct-21 | Evergreen Services Group | Third Wave Business Systems | Provider of enterprise resource planning software support services. |
| Oct-21 | Accenture | Xoomworks | Provider of IT consulting services focused on procurement activity. |
| Oct-21 | IBM | Boxboat Technologies | Provider of digital transformation services. |
| Oct-21 | EY-Parthenon | CMA Strategy Consulting | Boutique consulting firm primarily focused on the digital infrastructure space. |
| Oct-21 | Xerox | Competitive Computing | Provider of information technology consulting services. |
| Sep-21 | Accenture | BITT Consulting | Provider of data management and analytics services. |
| Sep-21 | Booz Allen | Tracepoint | Provider of cybersecurity services. |
| Aug-21 | Deloitte | Oya Solutions | Provider of contract lifecycle management solutions intended to help accelerate digital transformation. |
| Aug-21 | Cognizant Technology Solutions | Hunter Technical Resources | Provider of IT recruiting and staffing. |
| Aug-21 | WestView Capital Partners | Framework Solutions | Provider of outsourced business and consulting services. |
| Aug-21 | Nasstar | KCOM’s National ICT Business | Provider of information and communications technology (ICT) and connectivity services. |
| Jul-21 | HIG Capital | Project Informatica | Provider of hardware and software technological solutions. |
| Jun-21 | Converge Technology Solutions | ExactlyIT | Provider of managed IT services specializing in cloud services, cybersecurity, end-user support and technology solutions. |
| Jun-21 | Booz Allen | Liberty IT Solutions | Provider of IT services to multiple government agencies across a diverse portfolio of health IT projects. |
| Jun-21 | Deloitte | CloudQuest | Provider of cloud security posture management solutions. |
| Jun-21 | Evergreen Services Group | VirtualArmour International | Provider of advanced network and cybersecurity products. |
| Jun-21 | Ntiva | NetLogicDC | Provider of IT services intended for the hospitality sector and other generalized businesses. |
| May-21 | KKR | Ensono | Provider of hybrid IT managed services. |
| May-21 | Aya Healthcare | Dawson Healthcare | Provider of staffing services catering to the healthcare sector. |
| May-21 | OceanSound Partners | C2S Consulting Group | Provider of cloud consulting and migration services. |
| Apr-21 | Quisitive Technology Solutions | Mazik Global | MSP for CRM and ERP systems. |
| Feb-21 | Calligo | Decisive Data | Provider of end-to-end business analytics focusing on data analytics, data science and visualization. |
| Feb-21 | Baring Private Equity | Virtusa | Global provider of digital strategy, digital engineering, and IT services. |
| Jan-21 | Coverge | Vicom Computer Services | Full-service multi-cloud infrastructure provider. |
Public Company Valuations and Key Financial Data
Industry Summary
| Segment | Market Cap | EV | LTM Revenue | LTM Gross Profit | LTM EBITDA | EBITDA Margin | EV / Revenue | EV / EBITDA |
|---|---|---|---|---|---|---|---|---|
| IT and Cloud Consulting Services | ||||||||
| Median | $8,528.2 | $12,502.2 | $9,477.1 | $2,973.4 | $2,234.3 | 16.9% | 2.4x | 20.7x |
| Average | $42,279.0 | $42,700.0 | $13,040.9 | $3,983.9 | $2,234.3 | 14.1% | 3.4x | 33.7x |
| Staffing and Human Capital Management Services | ||||||||
| Median | $3,036.3 | $2,974.1 | $3,187.5 | $1,035.5 | $269.1 | 5.8% | 0.6x | 11.5x |
| Average | $4,937.8 | $5,087.4 | $7,443.9 | $1,801.2 | $451.7 | 7.3% | 0.9x | 12.6x |
| Professional Services | ||||||||
| Median | $1,971.9 | $2,366.7 | $1,599.4 | $571.4 | $231.7 | 13.7% | 1.7x | 13.4x |
| Average | $3,172.4 | $3,381.8 | $1,895.3 | $573.8 | $297.2 | 14.7% | 2.1x | 13.1x |
| Median | $4,479.6 | $4,412.4 | $2,065.7 | $790.5 | $302.8 | 11.4% | 1.7x | 13.73x |
| Average | $17,388.3 | $17,648.0 | $7,887.5 | $2,226.3 | $1,027.2 | 11.6% | 2.1x | 19.2x |
IT and Cloud Consulting Services
| Company Name | Ticker | Market Cap | EV | LTM Revenue | LTM Gross Profit | LTM EBITDA | EBITDA Margin | EV / Revenue | EV / EBITDA |
|---|---|---|---|---|---|---|---|---|---|
| Accenture PLC | ACN | $232,109.0 | $228,010.8 | $50,533.4 | $16,364.1 | $8,612.0 | 17.0% | 4.5x | 26.5x |
| Capgemini SE | CAP | $41,156.9 | $47,969.9 | $20,238.9 | $5,322.6 | $2,503.3 | 12.4% | 2.4x | 19.2x |
| Cognizant Technology Solutions Corp | CTSH | $42,288.0 | $41,553.0 | $17,914.0 | $6,678.0 | $3,108.0 | 17.3% | 2.3x | 13.4x |
| Devoteam SA | DVT | $1,605.0 | $1,563.2 | $957.5 | $447.5 | $125.9 | 13.1% | 1.6x | 12.4x |
| DXC Technology Company | DXC | $8,528.2 | $12,502.2 | $16,841.0 | $3,604.0 | $3,399.0 | 20.2% | 0.7x | NM |
| Insigma Technology Co Ltd | 600797 | $998.2 | $1,079.1 | $636.0 | $170.7 | $2.9 | 0.5% | 1.7x | NM |
| Perficient, Inc. | PRFT | $4,883.5 | $5,050.3 | $708.9 | $271.7 | $119.9 | 16.9% | 7.1x | 42.1x |
| Quisitive Technology Solutions, Inc. | QUIS | $297.4 | $349.8 | $61.4 | $23.1 | $3.4 | 5.6% | 5.7x | 101.8x |
| Wipro Limited | 507685 | $48,644.4 | $46,221.8 | $9,477.1 | $2,973.4 | $2,234.3 | 23.6% | 4.9x | 20.7x |
| Median | $8,528.2 | $12,502.2 | $9,477.1 | $2,973.4 | $2,234.3 | 16.9% | 2.4x | 20.7x | |
| Average | $42,279.0 | $42,700.0 | $13,040.9 | $3,983.9 | $2,234.3 | 14.1% | 3.4x | 33.7x |
Staffing and Human Capital Management Services
| Company Name | Ticker | Market Cap | EV | LTM Revenue | LTM Gross Profit | LTM EBITDA | EBITDA Margin | EV / Revenue | EV / EBITDA |
|---|---|---|---|---|---|---|---|---|---|
| Adecco Group AG | ADEN | $8,251.2 | $9,406.7 | $24,407.5 | $4,844.6 | $1,070.5 | 4.4% | 0.4x | 8.8x |
| ASGN Incorporated | ASGN | $6,640.7 | $7,057.8 | $4,304.6 | $1,211.6 | $448.2 | 10.4% | 1.6x | 15.7x |
| BGSF Inc. | BGSF | $145.7 | $191.9 | $294.2 | $84.6 | $18.8 | 6.4% | 0.7x | 10.2x |
| Kelly Services Inc. | KELYA | $813.3 | $835.7 | $4,743.6 | $859.4 | $144.5 | 3.0% | 0.2x | 5.8x |
| Kforce Inc. | KFRC | $1,630.8 | $1,634.3 | $1,523.6 | $437.3 | $103.5 | 6.8% | 1.1x | 15.8x |
| Korn Ferry Inc. | KFY | $4,441.7 | $4,313.9 | $2,061.2 | $1,971.6 | $393.8 | 19.1% | 2.1x | 11.0x |
| Randstad Holding N.V. | RAND | $13,313.1 | $13,585.7 | $28,169.9 | $5,482.5 | $1,479.4 | 5.3% | 0.5x | 9.2x |
| Robert Half International Inc. | RHI | $13,074.6 | $12,709.5 | $5,995.6 | $2,466.2 | $768.7 | 12.8% | 2.1x | 16.5x |
| TrueBlue, Inc. | TBI | $993.8 | $1,014.2 | $2,070.3 | $514.3 | $84.1 | 4.1% | 0.5x | 12.1x |
| Volt Information Sciences, Inc. | VOLT | $72.9 | $124.5 | $868.7 | $139.6 | $5.9 | 0.7% | 0.1x | 21.2x |
| Median | $3,036.3 | $2,974.1 | $3,187.5 | $1,035.5 | $269.1 | 5.8% | 0.6x | 11.5x | |
| Average | $4,937.8 | $5,087.4 | $7,443.9 | $1,801.2 | $451.7 | 7.3% | 0.9x | 12.6x |
Professional Services
| Company Name | Ticker | Market Cap | EV | LTM Revenue | LTM Gross Profit | LTM EBITDA | EBITDA Margin | EV / Revenue | EV / EBITDA |
|---|---|---|---|---|---|---|---|---|---|
| Capita plc | CPI | $1,050.8 | $2,358.8 | $4,385.3 | $941.1 | $641.2 | 14.6% | 0.5x | 3.7x |
| ExlService Holdings, Inc. | EXLS | $4,517.5 | $4,510.9 | $1,075.8 | $417.7 | $231.7 | 21.5% | 4.2x | 19.5x |
| FTI Consulting, Inc. | FCN | $4,896.1 | $5,105.3 | $2,726.6 | $854.9 | $373.9 | 13.7% | 1.9x | 13.7x |
| Houlihan Lokey, Inc. | HLI | $8,015.6 | $7,257.5 | $1,948.6 | $726.1 | $579.1 | 29.7% | 3.7x | 12.5x |
| Huron Consulting Group Inc | HURN | $1,146.5 | $1,465.2 | $866.3 | $250.5 | $62.7 | 7.2% | 1.7x | NM |
| ICF International, Inc. | ICFI | $1,971.9 | $2,366.7 | $1,599.4 | $571.4 | $145.1 | 9.1% | 1.5x | 16.3x |
| Resources Connection, Inc. | RGP | $608.6 | $608.4 | $665.3 | $254.9 | $46.5 | 7.0% | 0.9x | 13.1x |
| Median | $1,971.9 | $2,366.7 | $1,599.4 | $571.4 | $231.7 | 13.7% | 1.7x | 13.4x | |
| Average | $3,172.4 | $3,381.8 | $1,895.3 | $573.8 | $297.2 | 14.7% | 2.1x | 13.1x |
As of November 9th, 2021; USD unless otherwise specified
Source: Public company filings and Pitchbook; Extreme outliers were removed from the EV/EBITDA multiple calculation

