SaaS M&A Trends: Winter 2023
Published December 19, 2022

Key Insights
- Product-led growth strategy to unleash revenue potential.
- The rise of micro-SaaS products as companies look for cost-cutting solutions.
- Government’s increasing interest in SaaS applications.
- Increase in cyber attacks lead to an acceleration in cybersecurity spending.
SaaS M&A Commentary
After reaching stratospheric levels, SaaS valuations have experienced an extreme plunge over the last year as the market conducts a rerating of the landscape. Also contributing to this drawdown are broader bear market factors in the face of a possible recession. While some prominent SaaS companies have experienced 70%+ declines, we believe it’s important to keep in mind that the SaaS model is fundamentally intact.
For years, the market has experienced extreme exuberance, favoring growth stories fueled by lower interest rates, leading SaaS firms globally to prioritize bloated operating budgets. It is likely that the combination of broader economic uncertainty, high interest rates, geopolitical tensions, and negative sentiment toward technology have caused an overcorrection in SaaS valuations, although valuations are not anticipated to return to normality until the above factors have abated. Now we are at a critical juncture for SaaS, in which priorities have shifted wherein efficiency and profitability are front of mind.
SaaS Middle Market M&A Activity and Trends
SaaS M&A Commentary
- After reaching stratospheric levels, SaaS valuations have experienced an extreme plunge over the last year as the market conducts a rerating of the landscape. Also contributing to this drawdown are broader bear market factors in the face of a possible recession. While some prominent SaaS companies have experienced 70%+ declines, we believe it’s important to keep in mind that the SaaS model is fundamentally intact.
- For years, the market has experienced extreme exuberance, favoring growth stories fueled by lower interest rates, leading SaaS firms globally to prioritize bloated operating budgets.
- It is likely that the combination of broader economic uncertainty, high interest rates, geopolitical tensions, and negative sentiment toward technology have caused an overcorrection in SaaS valuations, although valuations are not anticipated to return to normality until the above factors have abated.
- Now we are at a critical juncture for SaaS, in which priorities have shifted wherein efficiency and profitability are front of mind.
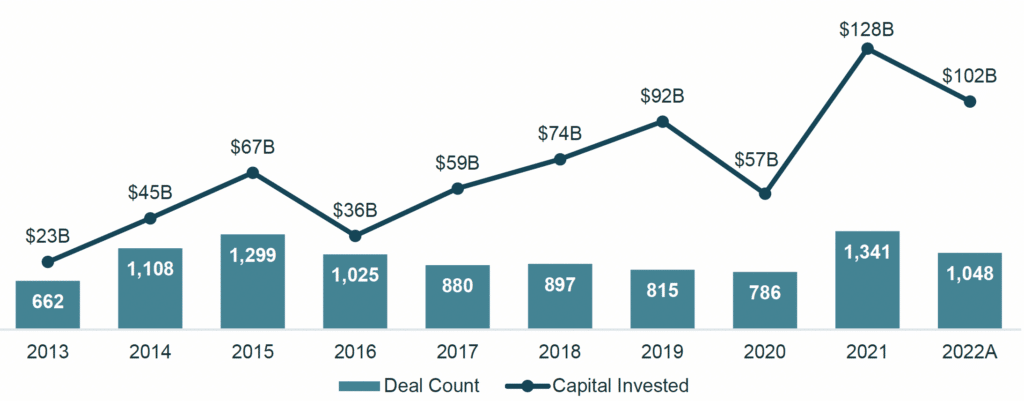
Recent SaaS M&A Transaction Activity
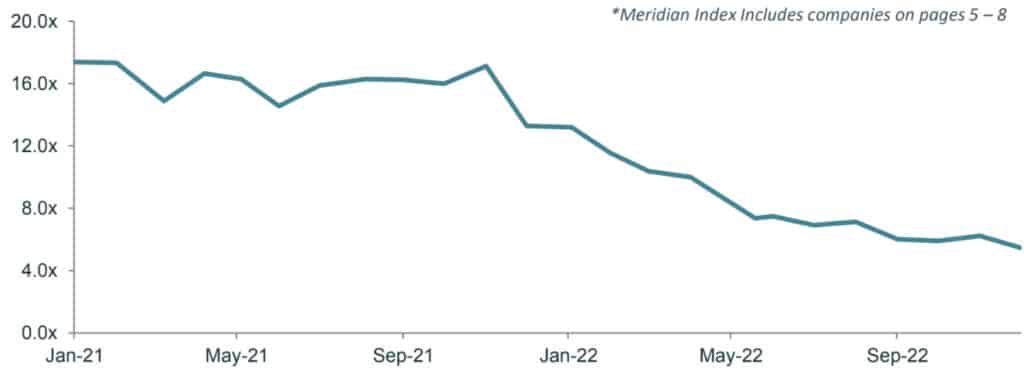
SaaS Public Market Valuations (EV/Revenue)
2022A*: As of December 16, 2022
Source: PitchBook Data, Mergermarket, Company Press Releases, Meridian Research
SaaS Market Insights
Product-led Growth Strategy to Unleash Revenue Potential
- Product-led Growth (“PLG”), the go-to-market strategy in which product usage drives customer acquisition and expansion, is becoming increasingly common among SaaS companies.
- The product-led SaaS business model tends to grow faster due to lower customer acquisition cost without the distraction of having to build a payments infrastructure.
- Nearly 60% of Forbes Cloud 100 companies in 2022 use PLG strategy, and 70% of the top 50 allow users to try the product for free before buying or upgrading services.
- PLG helps companies scale faster and more efficiently while keeping costs low and maintaining a high profitability margin.
The Rise of Micro-SaaS Products as Companies Look for Cost-Cutting Solutions
- Micro-SaaS targets a niche market, using minimal resources while solving for efficiencies, e.g., Storemapper is one of the first-known examples of the Micro-SaaS model.
- Due to tight labor market conditions, combined with a growing need to expand margins, many businesses are turning to micro-SaaS for their business needs.
- Niche SaaS solutions are now seeing a lot of development, especially during challenging economic times when firms look for cost-cutting solutions.
- Many of the firms involved in Micro-SaaS have lean sales and marketing teams, leading to less operational bloat as the necessity of the product itself acts as its own marketing strategy.
- As investors flock to capture early-stage growth opportunities, it is expected that Micro-SaaS companies will rebound in the near-term.
Government’s Increasing Interest in SaaS Applications
- Government leaders are increasingly noticing the growing need to improve legacy systems.
- SaaS solutions offer flexibility, allowing for customization and secure APIs that make it easy to aggregate and access data in a safe and secure manner that government organizations require.
- SaaS has put in considerable work to change the perception that cloud-based solutions are less secure than on-premises software, leveraging the fact that SaaS solutions are upgraded and optimized daily, making them more impervious to attack.
- A recent survey of state Chief Information Officers (CIOs) indicated that their top technology priorities are cloud solutions and SaaS implementation.
Increase in Cyber Attacks Lead to an Acceleration in Cybersecurity Spending
- The SEC has proposed new cybersecurity risk management rules and amendments to enhance cybersecurity preparedness and improve the resilience of investment advisers and investment companies against cybersecurity threats and attacks.
- According to the United States Government Accountability Office (“GAO”), the cost of major cyber attacks have increased 453% from 2016 to 2021.
- Among surveyed CIOs, cybersecurity has become one of the most important risk factors when considering information technology strategy.
- With the never-ending cybersecurity race accelerating at unprecedented levels, industry forecasts suggest record level spending on the horizon.
Source: NASCIO, Financial News Media, Forbes, Cyber Security Drive, TechCrunch, BDO, SEC, McKinsey, PitchBook, Mergermarket, Press Releases, Company Research
SaaS Selected M&A Activity
Highlighted Sales & Marketing SaaS Transaction

Adobe Systems Acquires Figma (ANNOUNCED)
Sept 2022
EV
$20,000M
EV/Revenue
50.0x
Target Description: Figma is a developer of a design tool built to help companies brainstorm, design, and build better products from start to finish.
Investment Rationale: This acquisition will enhance productivity, accelerate creativity on the web, advance product design and inspire global communities of creators, designers, and developers. The combined company will have a massive, fast-growing market opportunity and capabilities to drive significant value for customers, shareholders, and the industry.
Highlighted Cybersecurity SaaS Transaction
Thoma Bravo Acquires SailPoint
Aug 2022
EV
$8,486M
EV/Revenue
17.1x
Target Description: SailPoint is the leader in identity security for the modern enterprise. Harnessing the power of AI and machine learning, SailPoint automates the management and control of access.
Investment Rationale: This transaction will position SailPoint to drive innovation in identity security, expand its global customer base, and continue providing industry-leading identity security solutions to modern enterprises around the world.
Highlighted MSP SaaS Transaction

Kaseya Acquires Datto
Jun 2022
EV
$6,200M
EV/Revenue
9.3x
Target Description: Datto is the leading global provider of security and cloud-based software solutions purpose-built for Managed Service Providers (MSPs).
Investment Rationale: This acquisition will strengthen Kaseya’s IT Complete platform with an enhanced array of best-in-class solutions to help increase MSP efficiency and profitability. Customers can immediately expect substantial investments focused on upgrades and innovations to all Datto product offerings.
Source: PitchBook Data, Mergermarket, Company Press Releases, Meridian Research
Public Company Valuations
Public Company Valuations Summary
| By Category | Market Cap | E/V | LTM Rev | LTM EBITDA | LTM EBITDA Margin | EV/Rev | EV/EBITDA | 52-Week |
|---|---|---|---|---|---|---|---|---|
| Communications & Collaboration | $5,247 | $5,554 | $1,286 | ($92) | (15%) | 4.6x | 39.8x | (46%) |
| Data & Analytics | 9,851 | 9,930 | 1,179 | (121) | (21%) | 7.2x | 31.2x | (31%) |
| DevOps | 11,005 | 11,378 | 1,137 | (154) | (22%) | 9.3x | 87.5x | (37%) |
| Ecommerce | 753 | 854 | 268 | (95) | (37%) | 3.5x | nm | (48%) |
| Education | 2,677 | 2,847 | 746 | (289) | (27%) | 3.9x | 41.0x | (15%) |
| Entertainment | 35,373 | 37,710 | 10,097 | 3,498 | (5%) | 5.4x | 34.4x | (52%) |
| Financial | 15,299 | 15,702 | 2,687 | 215 | (16%) | 7.0x | 43.1x | (25%) |
| Food Delivery | 2,000 | 1,895 | 314 | (66) | (22%) | 5.6x | nm | (19%) |
| Healthcare | 8,333 | 8,317 | 1,152 | (2,272) | (365%) | 7.9x | 52.2x | (44%) |
| Human Capital Management | 14,668 | 14,812 | 1,535 | 49 | (4%) | 10.6x | 66.1x | (12%) |
| Internet | 8,447 | 10,463 | 2,718 | 311 | 6% | 4.0x | 22.1x | (21%) |
| Other | 10,332 | 10,722 | 1,326 | 154 | (15%) | 6.8x | 39.1x | (17%) |
| Sales and Marketing | 29,776 | 30,550 | 4,604 | 904 | (7%) | 6.2x | 34.8x | (42%) |
| Security | 13,340 | 13,639 | 1,503 | 19 | (4%) | 10.2x | 21.1x | (24%) |
| Supply Chain & ERP | 53,604 | 67,896 | 9,273 | 3,072 | (10%) | 6.0x | 25.1x | (19%) |
| Median | $10,332 | $10,722 | $1,326 | $19 | (15%) | 6.2x | 39.1x | (25%) |
| Mean | $14,714 | $16,151 | $2,655 | $342 | (38%) | 6.6x | 41.4x | (30%) |
Public Company Valuations by Categories
| Communication & Collaboration | Ticker | Market Cap | Enterprise Value | LTM Rev | LTM EBITDA | LTM EBITDA Margin | EV/Rev | EV/EBITDA | 52-Week |
|---|---|---|---|---|---|---|---|---|---|
| Zoom Video Communications | ZM | $21,404 | $20,408 | $4,347 | $498 | 11% | 4.7x | 41.0x | (65%) |
| DocuSign | DOCU | 11,974 | 12,179 | 2,437 | (28) | (1%) | 5.0x | nm | (64%) |
| Twilio | TWLO | 9,407 | 10,027 | 3,644 | (1,037) | (28%) | 2.8x | nm | (82%) |
| Dropbox | DBX | 8,608 | 10,516 | 2,292 | 517 | 23% | 4.6x | 20.3x | (5%) |
| Smartsheet | SMAR | 5,582 | 5,458 | 712 | (204) | (29%) | 7.7x | nm | 0% |
| Five9 | FIVN | 5,168 | 5,829 | 744 | (32) | (4%) | 7.8x | nm | (48%) |
| Workiva | WK | 4,412 | 4,557 | 515 | (77) | (15%) | 8.9x | nm | (37%) |
| Box | BOX | 4,529 | 4,748 | 968 | 89 | 9% | 4.9x | 53.1x | 18% |
| RingCentral | RNG | 4,018 | 5,389 | 1,912 | (458) | (24%) | 2.8x | nm | (78%) |
| Asana | ASAN | 3,294 | 3,043 | 509 | (387) | (76%) | 6.0x | nm | (81%) |
| PagerDuty | PD | 2,346 | 2,386 | 348 | (119) | (34%) | 6.9x | nm | 0% |
| Everbridge | EVBG | 1,257 | 1,582 | 418 | (20) | (5%) | 3.8x | nm | (55%) |
| Bandwidth (US) | BAND | 650 | 1,135 | 542 | 25 | 5% | 2.1x | 44.9x | (66%) |
| Agora | API | 448 | 422 | 161 | (99) | (61%) | 2.6x | nm | (78%) |
| Ribbon Communications | RBBN | 506 | 846 | 817 | (142) | (17%) | 1.0x | nm | (55%) |
| Ooma | Ooma | 351 | 345 | 210 | 3 | 1% | 1.6x | nm | (33%) |
| Median | $4,215 | $4,652 | $728 | ($54) | (10%) | 4.6x | 42.9x | (55%) | |
| Mean | $5,247 | $5,554 | $1,286 | ($92) | (15%) | 4.6x | 39.8x | (46%) |
| Data & Analytics | Ticker | Market Cap | E/V | LTM Rev | LTM EBITDA | LTM EBITDA Margin | EV/Rev | EV/EBITDA | 52-Week |
|---|---|---|---|---|---|---|---|---|---|
| Snowflake(Database Software) | SNOW | $47,983 | $47,418 | $1,860 | ($730) | (39%) | 25.5x | nm | 0% |
| Palantir Technologies | PLTR | 15,289 | 13,123 | 1,830 | (508) | (28%) | 7.2x | nm | (63%) |
| Akamai Technologies | AKAM | 13,969 | 16,665 | 3,594 | 1,282 | 36% | 4.6x | 13.0x | (26%) |
| MongoDB | MDB | 14,595 | 14,780 | 1,189 | (326) | (27%) | 12.4x | nm | (59%) |
| Nutanix | NTNX | 7,667 | 8,627 | 1,636 | (320) | (20%) | 5.3x | nm | 4% |
| Elasticsearch | ESTC | 5,743 | 5,485 | 978 | (183) | (19%) | 5.6x | nm | (53%) |
| Alteryx | AYX | 3,518 | 4,373 | 728 | (271) | (37%) | 6.0x | nm | (20%) |
| CommVault Systems | CVLT | 2,880 | 2,631 | 794 | 53 | 7% | 3.3x | 49.5x | (6%) |
| Appian | APPN | 2,753 | 2,762 | 447 | (136) | (30%) | 6.2x | nm | (47%) |
| Udemy | UDMY | 1,700 | 1,287 | 599 | (122) | (20%) | 2.1x | nm | (34%) |
| Amplitude | AMPL | 1,505 | 1,269 | 222 | (86) | (39%) | 5.7x | nm | 0% |
| Health Catalyst | HCAT | 613 | 737 | 272 | (101) | (37%) | 2.7x | nm | (72%) |
| Median | $4,631 | $4,929 | $886 | ($159) | (28%) | 5.7x | 31.2x | (30%) | |
| Mean | $9,851 | $9,930 | $1,179 | ($121) | (21%) | 7.2x | 31.2x | (31%) |
| DevOps | Ticker | Market Cap | E/V | LTM Rev | LTM EBITDA | LTM EBITDA Margin | EV/Rev | EV/EBITDA | 52-Week |
|---|---|---|---|---|---|---|---|---|---|
| Atlassian | TEAM | $38,290 | $38,133 | $2,996 | ($75) | (3%) | 12.7x | nm | (58%) |
| Datadog | DDOG | 25,557 | 26,099 | 1,532 | 20 | 1% | 17.0x | nm | (54%) |
| Splunk | SPLK | 14,995 | 18,234 | 3,304 | (492) | (15%) | 5.5x | nm | 0% |
| Unity | U | 13,111 | 13,683 | 1,256 | (600) | (48%) | 10.9x | nm | (79%) |
| Dynatrace | DT | 11,747 | 11,466 | 1,040 | 131 | 13% | 11.0x | 87.5x | (32%) |
| GitLab | GTLB | 7,440 | 7,068 | 379 | (188) | (50%) | 18.6x | nm | 0% |
| New Relic | NEWR | 4,275 | 4,356 | 853 | (134) | (16%) | 5.1x | nm | (40%) |
| JFrog | FROG | 2,336 | 2,305 | 263 | (73) | (28%) | 8.8x | nm | (23%) |
| Fastly | FSLY | 1,169 | 1,917 | 411 | (110) | (27%) | 4.7x | nm | (78%) |
| UserTesting | USER | 1,068 | 918 | 185 | (63) | (34%) | 5.0x | nm | 0% |
| Sumo Logic | SUMO | 1,069 | 980 | 288 | (112) | (39%) | 3.4x | nm | (42%) |
| Median | $7,440 | $7,068 | $853 | ($110) | (27%) | 8.8x | 87.5x | (40%) | |
| Mean | $11,005 | $11,378 | $1,137 | ($154) | (22%) | 9.3x | 87.5x | (37%) |
| Ecommerce | Ticker | Market Cap | E/V | LTM Rev | LTM EBITDA | LTM EBITDA Margin | EV/Rev | EV/EBITDA | 52-Week |
|---|---|---|---|---|---|---|---|---|---|
| Zuora | ZUO | $864 | $940 | $384 | ($95) | (25%) | 2.5x | nm | (68%) |
| VTEX | VTEX | 709 | 687 | 149 | (59) | (39%) | 4.6x | nm | 0% |
| BigCommerce | BIGC | $686 | $936 | $272 | ($131) | (48%) | 3.4x | nm | (75%) |
| Median | $709 | $936 | $272 | ($95) | (39%) | 3.4x | nm | (68%) | |
| Mean | $753 | $854 | $268 | ($95) | (37%) | 3.5x | nm | (48%) |
| Education | Ticker | Market Cap | E/V | LTM Rev | LTM EBITDA | LTM EBITDA Margin | EV/Rev | EV/EBITDA | 52-Week |
|---|---|---|---|---|---|---|---|---|---|
| Qualtrics | XM | $6,333 | $5,876 | $1,386 | ($997) | (72%) | 4.2x | nm | 0% |
| Instructure | INST | 3,523 | 3,780 | 461 | 92 | 20% | 8.2x | 41.0x | 5% |
| 2U | TWOU | 614 | 1,487 | 971 | (192) | (20%) | 1.5x | nm | (65%) |
| Kaltura | KLTR | 237 | 244 | 167 | (58) | (34%) | 1.5x | nm | 0% |
| Median | $2,068 | $2,634 | $716 | ($125) | (27%) | 2.9x | 41.0x | 0% | |
| Mean | $2,677 | $2,847 | $746 | ($289) | (27%) | 3.9x | 41.0x | (15%) |
| Entertainment | Ticker | Market Cap | E/V | LTM Rev | LTM EBITDA | LTM EBITDA Margin | EV/Rev | EV/EBITDA | 52-Week |
|---|---|---|---|---|---|---|---|---|---|
| Netflix | NFLX | $141,441 | $149,215 | $31,473 | $19,845 | 63% | 4.7x | 7.5x | (51%) |
| Spotify | SPOT | 15,319 | 14,291 | 12,172 | 80 | 1% | 1.2x | nm | (69%) |
| Match Group | MTCH | 12,446 | 15,934 | 3,209 | 260 | 8% | 5.0x | 61.3x | (67%) |
| Peloton (Recreational Goods) | PTON | 4,135 | 5,660 | 3,393 | (2,649) | (78%) | 1.7x | nm | (73%) |
| Sprout Social | SPT | 3,525 | 3,452 | 237 | (44) | (19%) | 14.5x | nm | 0% |
| Median | $12,446 | $14,291 | $3,393 | $80 | 1% | 4.7x | 34.4x | (67%) | |
| Mean | $35,373 | $37,710 | $10,097 | $3,498 | (5%) | 5.4x | 34.4x | (52%) |
| Financial | Ticker | Market Cap | E/V | LTM Rev | LTM EBITDA | LTM EBITDA Margin | EV/Rev | EV/EBITDA | 52-Week |
|---|---|---|---|---|---|---|---|---|---|
| Intuit | INTU | $117,685 | $123,161 | $13,316 | $3,276 | 25% | 9.2x | 37.6x | (36%) |
| Adyen | ADYEN | 48,891 | 43,313 | 8,321 | 836 | 10% | 5.2x | 51.8x | (40%) |
| Block | SQ | 42,613 | 43,319 | 16,959 | (191) | (1%) | 2.6x | nm | (61%) |
| Bill.com | BILL | 13,088 | 13,335 | 754 | (250) | (33%) | 17.7x | nm | (54%) |
| Black Knight | BKI | 9,443 | 12,137 | 1,555 | 628 | 40% | 7.8x | 19.3x | (28%) |
| Coupa | COUP | 5,989 | 7,666 | 818 | (132) | (16%) | 9.4x | nm | (50%) |
| BlackLine | BL | 4,244 | 5,453 | 498 | (38) | (8%) | 10.9x | nm | (34%) |
| Clearwater Analytics | CWAN | 3,457 | 3,243 | 291 | 2 | 1% | 11.2x | nm | 0% |
| nCino | NCNO | 3,005 | 2,975 | 374 | (78) | (21%) | 8.0x | nm | (54%) |
| EngageSmart | ESMT | 2,841 | 2,581 | 282 | 31 | 11% | 9.2x | 83.5x | 0% |
| Vertex | VERX | 2,368 | 2,371 | 472 | 53 | 11% | 5.0x | 44.3x | 0% |
| Q2 Software | QTWO | 1,596 | 2,136 | 551 | (30) | (6%) | 3.9x | nm | 0% |
| IntApp | INTA | 1,561 | 1,537 | 289 | (79) | (27%) | 5.3x | nm | 0% |
| EverCommerce | EVCM | 1,281 | 1,730 | 595 | 77 | 13% | 2.9x | 22.4x | 0% |
| Expensify | EXFY | 785 | 747 | 166 | (29) | (18%) | 4.5x | nm | 0% |
| Enfusion | ENFN | 659 | 595 | 142 | (301) | (213%) | 4.2x | nm | 0% |
| Domo | DOMO | 574 | 633 | 299 | (113) | (38%) | 2.1x | nm | (67%) |
| Median | $3,005 | $2,975 | $498 | ($30) | (6%) | 5.3x | 41.0x | (28%) | |
| Mean | $15,299 | $15,702 | $2,687 | $215 | (16%) | 7.0x | 43.1x | (25%) |
| Food Delivery | Ticker | Market Cap | E/V | LTM Rev | LTM EBITDA | LTM EBITDA Margin | EV/Rev | EV/EBITDA | 52-Week |
|---|---|---|---|---|---|---|---|---|---|
| Jamf | JAMF | $2,815 | $2,953 | $452 | ($89) | (20%) | 6.5x | nm | (37%) |
| Olo | OLO | 1,185 | 837 | 176 | (42) | (24%) | 4.8x | nm | 0% |
| Median | $2,000 | $1,895 | $314 | ($66) | (22%) | 5.6x | nm | (19%) | |
| Mean | $2,000 | $1,895 | $314 | ($66) | (22%) | 5.6x | nm | (19%) |
| Healthcare | Ticker | Market Cap | E/V | LTM Rev | LTM EBITDA | LTM EBITDA Margin | EV/Rev | EV/EBITDA | 52-Week |
|---|---|---|---|---|---|---|---|---|---|
| Veeva Systems | VEEV | $27,443 | $26,640 | $2,077 | $522 | 25% | 12.8x | 51.1x | (34%) |
| Teladoc Health | TDOC | 4,595 | 5,284 | 2,323 | (9,633) | (415%) | 2.3x | nm | (72%) |
| Definitive Healthcare | DH | 1,290 | 1,340 | 208 | 25 | 12% | 6.4x | 53.4x | 0% |
| Replicel Life Sciences | RP | 3 | 3 | 0 | (3) | (1,084%) | 10.2x | nm | (69%) |
| Median | $2,943 | $3,312 | $1,143 | $11 | (201%) | 8.3x | 52.2x | (52%) | |
| Mean | $8,333 | $8,317 | $1,152 | ($2,272) | (365%) | 7.9x | 52.2x | (44%) |
| Human Capital Management | Ticker | Market Cap | E/V | LTM Rev | LTM EBITDA | LTM EBITDA Margin | EV/Rev | EV/EBITDA | 52-Week |
|---|---|---|---|---|---|---|---|---|---|
| Workday | WDAY | $46,078 | $47,763 | $5,946 | $124 | 2% | 8.0x | nm | (36%) |
| Paycom Software | PAYC | 19,670 | 19,382 | 1,290 | 434 | 34% | 15.0x | 44.7x | 0% |
| Paylocity | PCTY | 11,684 | 11,694 | 924 | 134 | 14% | 12.7x | 87.6x | 0% |
| Ceridian HCM | CDAY | 10,621 | 11,473 | 1,192 | 42 | 4% | 9.6x | nm | (36%) |
| Monday.com | MNDY | 5,525 | 4,756 | 465 | (168) | (36%) | 10.2x | nm | 0% |
| Paycor | PYCR | 4,734 | 4,659 | 455 | 4 | 1% | 10.2x | nm | (10%) |
| Freshworks | FRSH | 4,362 | 3,960 | 470 | (223) | (47%) | 8.4x | nm | 0% |
| Median | $10,621 | $11,473 | $924 | $42 | 2% | 10.2x | 66.1x | 0% | |
| Mean | $14,668 | $14,812 | $1,535 | $49 | (4%) | 10.6x | 66.1x | (12%) |
| Internet | Ticker | Market Cap | E/V | LTM Rev | LTM EBITDA | LTM EBITDA Margin | EV/Rev | EV/EBITDA | 52-Week |
|---|---|---|---|---|---|---|---|---|---|
| GoDaddy | GDDY | $11,910 | $15,104 | $4,071 | $683 | 17% | 3.7x | 22.1x | 3% |
| Wix.com | WIX | 4,985 | 5,821 | 1,366 | (62) | (5%) | 4.3x | nm | (44%) |
| Median | $8,447 | $10,463 | $2,718 | $311 | 6% | 4.0x | 22.1x | (21%) | |
| Mean | $8,447 | $10,463 | $2,718 | $311 | 6% | 4.0x | 22.1x | (21%) |
| Other | Ticker | Market Cap | E/V | LTM Rev | LTM EBITDA | LTM EBITDA Margin | EV/Rev | EV/EBITDA | 52-Week |
|---|---|---|---|---|---|---|---|---|---|
| Autodesk | ADSK | $43,166 | $44,536 | $4,898 | $1,018 | 21% | 9.1x | 43.8x | (30%) |
| Bentley Systems | BSY | 11,354 | 13,107 | 1,080 | 297 | 28% | 12.1x | 44.1x | 0% |
| PTC | PTC | 14,954 | 16,222 | 1,933 | 571 | 30% | 8.4x | 28.4x | 2% |
| Blackbaud | BLKB | 3,112 | 3,989 | 1,031 | 87 | 8% | 3.9x | 46.1x | (27%) |
| Ansys | ANSS | 22,309 | 22,540 | 2,027 | 680 | 34% | 11.1x | 33.1x | 0% |
| Guidewire Software | GWRE | 5,384 | 5,618 | 842 | (208) | (25%) | 6.7x | nm | (44%) |
| Toast | TOST | 10,295 | 9,745 | 2,475 | (159) | (6%) | 3.9x | nm | 0% |
| Procore | PCOR | 7,298 | 7,119 | 664 | (231) | (35%) | 10.7x | nm | (33%) |
| AppFolio | APPF | 4,042 | 4,028 | 443 | (9) | (2%) | 9.1x | nm | (12%) |
| Agrify | AGFY | 7 | 39 | 78 | (153) | (198%) | 0.5x | nm | 0% |
| Duck Creek Technologies | DCT | 1,623 | 1,491 | 303 | 14 | 5% | 4.9x | nm | (60%) |
| DISCO | LAW | 434 | 232 | 136 | (58) | (43%) | 1.7x | nm | 0% |
| Median | $6,341 | $6,368 | $937 | $2 | 1% | 7.5x | 43.8x | (6%) | |
| Mean | $10,332 | $10,722 | $1,326 | $154 | (15%) | 6.8x | 39.1x | (17%) |
| Sales and Marketing | Ticker | Market Cap | E/V | LTM Rev | LTM EBITDA | LTM EBITDA Margin | EV/Rev | EV/EBITDA | 52-Week |
|---|---|---|---|---|---|---|---|---|---|
| Adobe Systems | ADBE | $158,029 | $158,800 | $17,191 | $6,900 | 40% | 9.2x | 23.0x | (41%) |
| Salesforce | CRM | 134,750 | 142,672 | 30,294 | 4,339 | 14% | 4.7x | 32.9x | 0% |
| The Trade Desk | TTD | 24,936 | 24,208 | 1,483 | 38 | 3% | 16.3x | nm | (48%) |
| HubSpot | HUBS | 15,231 | 15,636 | 1,631 | (48) | (3%) | 9.6x | nm | (55%) |
| ZoomInfo Technologies | ZI | 12,659 | 13,567 | 1,019 | 279 | 27% | 13.3x | 48.6x | (52%) |
| Pegasystems | PEGA | 3,124 | 3,698 | 1,238 | (218) | (18%) | 3.0x | nm | (65%) |
| Braze | BRZE | 2,708 | 2,714 | 327 | (146) | (45%) | 8.3x | nm | 0% |
| Sprinklr | CXM | 2,321 | 2,179 | 589 | (73) | (12%) | 3.7x | nm | 0% |
| LiveRamp Holdings | RAMP | 1,577 | 1,143 | 572 | (71) | (12%) | 2.0x | nm | (50%) |
| Momentive | MNTV | 1,171 | 1,213 | 476 | (85) | (18%) | 2.5x | nm | (63%) |
| Yext | YEXT | 807 | 765 | 400 | (53) | (13%) | 1.9x | nm | (40%) |
| Cyren | CYRN | 5 | 6 | 32 | (15) | (48%) | 0.2x | nm | (89%) |
| Median | $2,916 | $3,206 | $804 | ($50) | (12%) | 4.2x | 32.9x | (49%) | |
| Mean | $29,776 | $30,550 | $4,604 | $904 | (7%) | 6.2x | 34.8x | (42%) |
| Security | Ticker | Market Cap | E/V | LTM Rev | LTM EBITDA | LTM EBITDA Margin | EV/Rev | EV/EBITDA | 52-Week |
|---|---|---|---|---|---|---|---|---|---|
| Palo Alto Networks | PANW | $48,447 | $50,341 | $5,818 | $178 | 3% | 8.7x | nm | 0% |
| CrowdStrike Holdings | CRWD | 28,261 | 26,563 | 2,035 | (56) | (3%) | 13.1x | nm | (44%) |
| Zscaler | ZS | 17,758 | 17,893 | 1,216 | (277) | (23%) | 14.7x | nm | (62%) |
| Check Point Software Technologies | CHKP | 16,695 | 16,268 | 2,291 | 888 | 39% | 7.1x | 18.3x | 14% |
| Cloudflare | NET | 17,194 | 18,623 | 894 | (99) | (11%) | 20.8x | nm | (64%) |
| Okta | OKTA | 11,359 | 13,455 | 1,731 | (750) | (43%) | 7.8x | nm | 0% |
| F5 Networks | FFIV | 9,180 | 9,087 | 2,696 | 501 | 19% | 3.4x | 18.1x | (37%) |
| CyberArk Software | CYBR | 5,739 | 5,983 | 574 | (119) | (21%) | 10.4x | nm | (19%) |
| Qualys | QLYS | 4,478 | 4,324 | 469 | 161 | 34% | 9.2x | 26.9x | 0% |
| KnowBe4 | KNBE | 5,502 | 5,173 | 311 | 32 | 10% | 16.6x | nm | 0% |
| Tenable | TENB | 4,543 | 4,677 | 648 | (51) | (8%) | 7.2x | nm | (29%) |
| ForgeRock | FORG | 2,011 | 1,923 | 202 | (56) | (28%) | 9.5x | nm | 0% |
| Rapid7 | RPD | 2,249 | 2,998 | 652 | (104) | (16%) | 4.6x | nm | (69%) |
| Median | $9,180 | $9,087 | $894 | ($56) | (8%) | 9.2x | 18.3x | (19%) | |
| Mean | $13,340 | $13,639 | $1,503 | $19 | (4%) | 10.2x | 21.1x | (24%) |
| Supply Chain & ERP | Ticker | Market Cap | E/V | LTM Rev | LTM EBITDA | LTM EBITDA Margin | EV/Rev | EV/EBITDA | 52-Week |
|---|---|---|---|---|---|---|---|---|---|
| Oracle | ORCL | $220,607 | $304,713 | $46,073 | $17,704 | 38% | 6.6x | 17.2x | (17%) |
| ServiceNow | NOW | 84,515 | 85,392 | 6,919 | 668 | 10% | 12.3x | nm | 0% |
| Tyler Technologies | TYL | 13,933 | 14,884 | 1,832 | 377 | 21% | 8.1x | 39.4x | (36%) |
| C3.ai | AI | 1,438 | 1,163 | 270 | (241) | (89%) | 4.3x | nm | (61%) |
| WalkMe | WKME | 881 | 692 | 233 | (108) | (46%) | 3.0x | nm | 0% |
| Upland Software | UPLD | 249 | 533 | 314 | 29 | 9% | 1.7x | 18.6x | 0% |
| Median | $7,685 | $8,023 | $1,073 | $203 | 9% | 5.5x | 18.6x | (9%) | |
| Mean | $53,604 | $67,896 | $9,273 | $3,072 | (10%) | 6.0x | 25.1x | (19%) |
Meridian SaaS Index Valuation Multiples YoY Comparison (EV/Revenue)
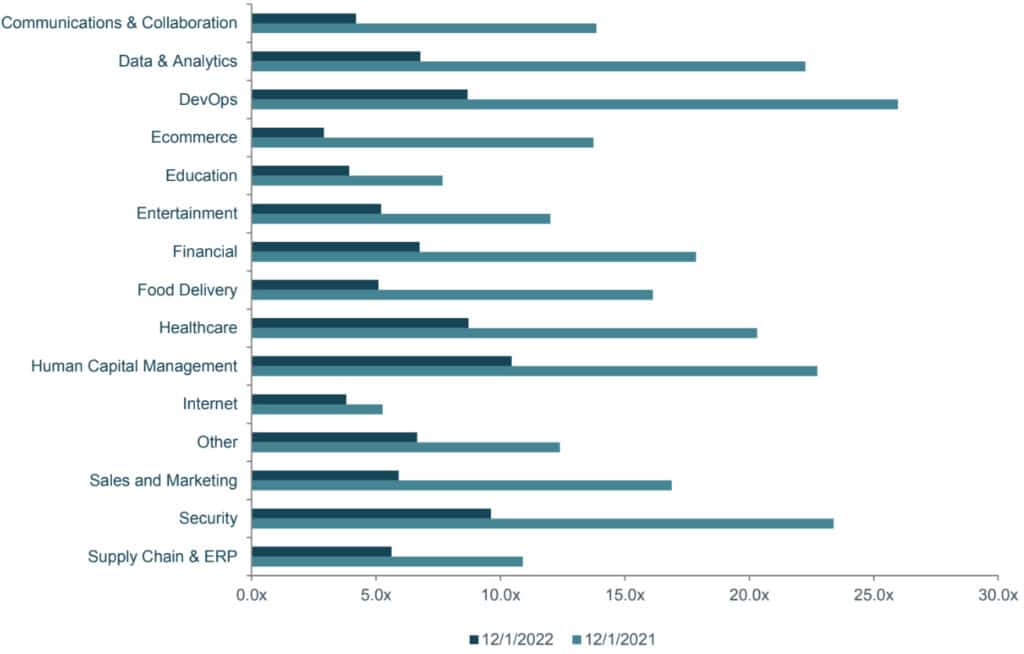
As of December 16, 2022
Source: PitchBook Data, Mergermarket, Company Press Releases, Meridian Research
Selected SaaS M&A Transactions
| Companies | Deal Date | Investors | Description | EV | EV/ Rev | EV/ EBITDA |
|---|---|---|---|---|---|---|
| FormSwift | Dec-22 | Dropbox | Provider of cloud-based solutions to help businesses of all sizes build, edit, approve, share and print personalized templates and documents. | $95 | nm | nm |
| Coupa | Dec-22 | Thoma Bravo | Cloud-based provider of business spending management, or BSM, solutions. | $6,150 | 10.2x | nm |
| Hyros | Dec-22 | Banzai International | Developer of a cloud-based ad-tracking platform designed to make it easy for online businesses to understand their sales data and make profitable decisions. | 110 | nm | nm |
| Attraqt Group | Dec-22 | Crownpeak Technology | Provider of visual merchandising and searches services to online retailers through Cloud-based SaaS platform. | 72 | 2.3x | nm |
| Zendesk | Nov-22 | Abu Dhabi Investment Authority | Provider of customer engagement software solutions. | 8,862 | 5.6x | nm |
| Computer Services | Nov-22 | Bridgeport Partners | Developer of technology solutions to banks, financial institutions, and other businesses nationwide. | 1,540 | 4.7x | 15.2x |
| ChannelAdvisor | Nov-22 | CommerceHub | Provider of SaaS solutions for retailers and manufacturers. | 575 | 3.3x | 29.7x |
| Rx Savings Solutions | Nov-22 | McKesson | Developer of a SaaS-based healthcare platform intended to save employers, employees and health plan money on prescription medications. | 875 | nm | nm |
| Avalara | Oct-22 | Vista Equity Partners | Provider of compliance solutions. | 6,939 | 8.8x | nm |
| The Nielsen Company | Oct-22 | Brookfield Business Partners | Provider of audience measurement, data and analytics services. | 15,234 | 4.3x | 11.5x |
| Trader Interactive | Oct-22 | Carsales.com | Provider of online advertising and marketing services intended to serve power sport, recreational vehicle, commercial truck and equipment industries. | 1,796 | nm | 1.0x |
| RapidMiner | Sep-22 | Altair Engineering | Developer of a data science platform designed to transform data into simplified business outcomes. | 100 | nm | nm |
| Rx Savings Solutions | Sep-22 | McKesson | Developer of a SaaS-based healthcare platform. | 875 | nm | nm |
| Figma | Sep-22 | Adobe Systems | Developer of a design tool built to help companies brainstorm, design, and build better products from start to finish. | 20,000 | nm | nm |
| ChannelAdvisor | Sep-22 | CommerceHub | Provider of Software-as-a-Service solutions for retailers and manufacturers. | 641 | 3.7x | 30.1x |
| Tufin | Aug-22 | Turn/River Capital | Provider of software-based solutions that help organizations visualize, define and enforce a unified security policy. | 492 | 4.1x | nm |
| Computer Services | Aug-22 | Bridgeport Partners | Provider of technology solutions to banks, financial institutions, and other businesses nationwide. | 1,524 | 4.8x | 14.4x |
| SailPoint Technologies | Aug-22 | Thoma Bravo | Provider of enterprise identity governance solutions. | 8,486 | 17.1x | nm |
| Avalara | Aug-22 | Vista Equity Partners | Provider of software solutions that help businesses comply with tax requirements for transactions worldwide. | 6,939 | 8.8x | nm |
| Brightly Software | Aug-22 | Siemens | Developer of a cloud-based operations management software. | 1,875 | nm | nm |
| Ping Identity | Aug-22 | Thoma Bravo | Provider of services to secure access to any service, application or API from any device. | 2,590 | 8.4x | nm |
| EVO Payments | Aug-22 | Global Payments | Provider of payment processing services. | 3,561 | 6.7x | 23.8x |
| Information Resources | Aug-22 | Hellman & Friedman | Provider of big data, predictive analytics and forward-looking insights to help businesses power action and growth. | 8,000 | nm | nm |
| PrescribeWellness | Aug-22 | BlackRock | Developer of a cloud-based patient relationship management software. | 140 | nm | nm |
| ADVA Optical Networking | Jul-22 | Adtran | Provider of optical and Ethernet-based networking solutions to telecommunications carriers and enterprises. | 722 | 1.0x | 17.0x |
| SundaySky | Jul-22 | Clearhaven Partners | Developer of a video engagement platform designed to engage people with personalized brands. | 100 | nm | nm |
| GTY Technology Holdings | Jul-22 | GI Partners | Provider of a cloud-based suite of solutions for North American state and local governments. | 361 | 5.7x | nm |
| Dan.com | Jul-22 | GoDaddy | Developer of an online domain marketplace designed to make unused domains accessible to all. | 75 | nm | nm |
| Budderfly | Jun-22 | Partners Group | Developer of energy management systems developed to maximize energy savings. | 500 | nm | nm |
| Trader Interactive | Jun-22 | Carsales.com | Provider of online advertising and marketing services. | 1,902 | nm | nm |
| Zendesk | Jun-22 | Abu Dhabi Investment Authority | Provider of customer engagement software solutions via single applications or the Sunshine suite. | 9,101 | 6.4x | nm |
| Datto | Jun-22 | Insight Partners | Provider of cloud-based software and technology solutions. | 6,009 | 9.3x | 53.5x |
Source: PitchBook Data, Mergermarket, Company Press Releases, Meridian Research
