Consumer Products M&A Trends: Spring 2020
Published June 16, 2020

The past few months have unquestionably brought major changes to the way consumers think about personal care and household care. Evidence that consumers have simultaneously relaxed their personal grooming routines and heightened their focus on household hygiene is everywhere – from the trending hashtag #quarantinebeard to widespread shortages of disinfectant cleaners.
Changes in consumer behavior have deeply affected the personal care and household care industries in just a few months. Demand for household cleaners and personal hygiene products have surged, generating triple-digit increases in sales of products such as hand sanitizer, while the virus has exacerbated the already-ongoing decline in sales of discretionary personal care items and cosmetics. Prestige cosmetics brands and fragrances have been particularly hard hit, seeing significant sales declines driven by social distancing, working from home, and mask wearing.
While a portion of this effect is driven by temporary measures – for example, somebody working from home has 11 fewer personal care occasions weekly than somebody who works away from the home – COVID-19 has prompted several changes that mirror longer-term trends in consumer preferences and will likely persist, at some level, post-pandemic. Purchases and usage of color cosmetics have been steadily declining for some time as women gravitate towards a more natural look. Months of social distancing, allowing consumers to spend significantly less time primping, are likely to accelerate the long-term trend of pared-back grooming routines and slow the recovery for certain categories of personal care products.
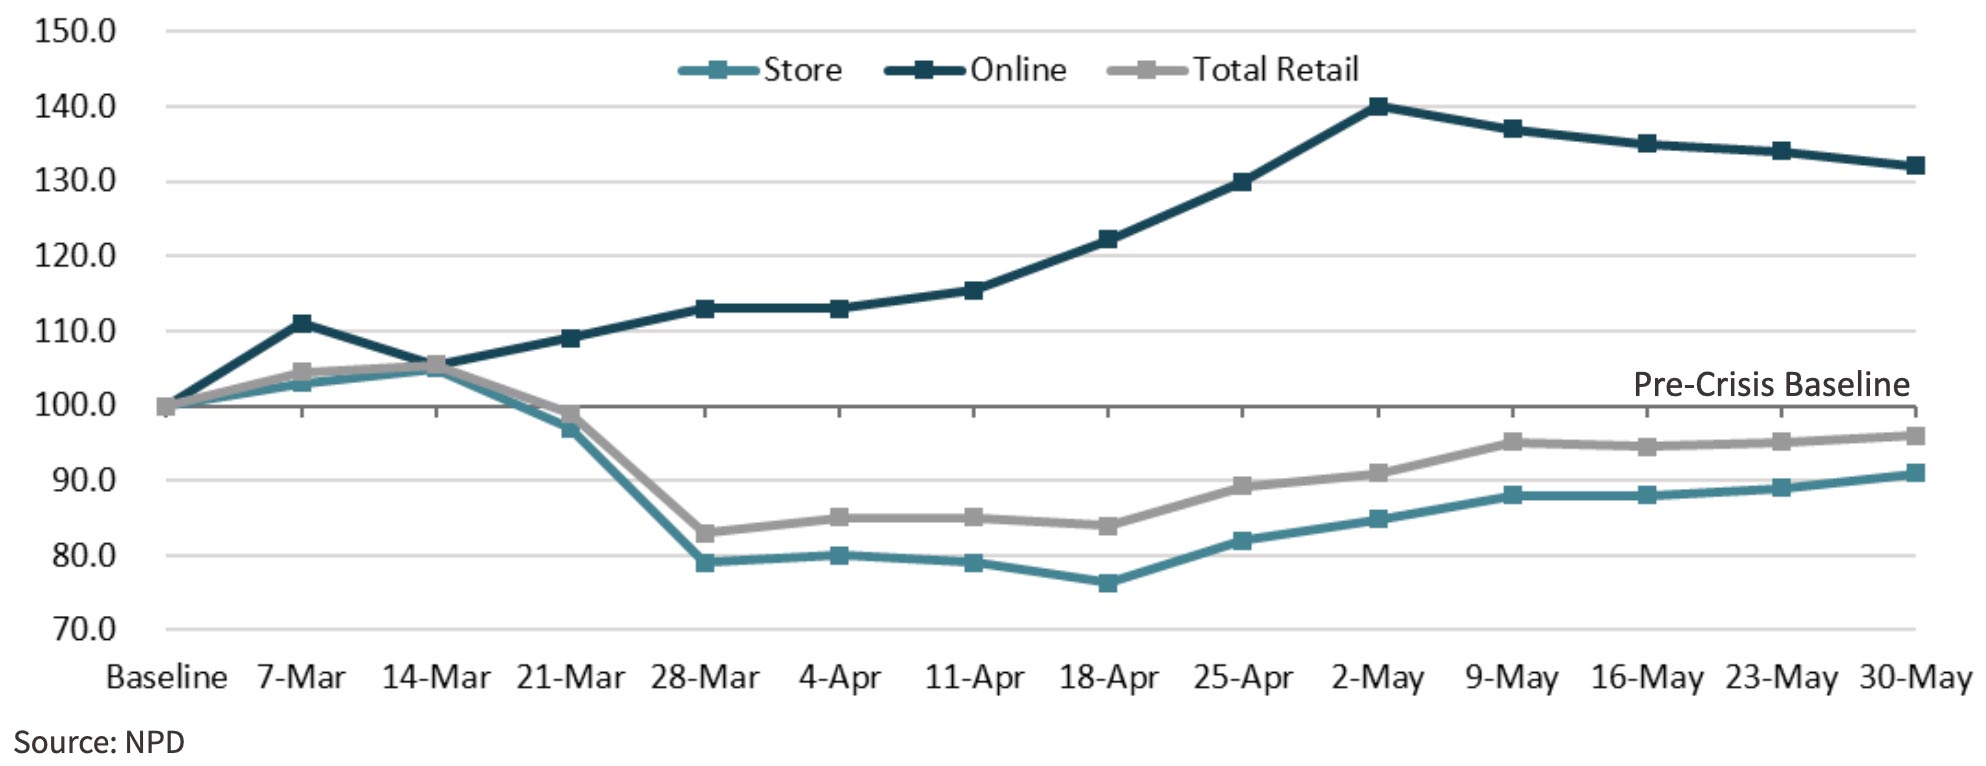
Meanwhile, the share of consumer products that is purchased online continues to rise, accelerating the pre-pandemic trend towards the increasing importance of e-commerce. Online sales were over 30% higher for the week of May 26 – June 1 vs. February pre-pandemic numbers, an increase much greater than the 15% year-over-year increase in e-commerce sales during 2019. The past few weeks have seen e-commerce sales begin to level off, but given the historical stickiness of e-commerce habits, it is reasonable to expect that the recent boost in online sales will endure post-pandemic.
Change brings opportunity, and the current situation presents an occasion for companies to align themselves with evolving consumer preferences, to connect with consumers, and to build loyalty. In this update, we’ll discuss how purchasing patterns have changed – both in terms of what consumers are purchasing and how they’re purchasing it – and examine how today’s landscape could shape the future of household and personal care products.
Consumer Spending by Category Reflects Changing Priorities
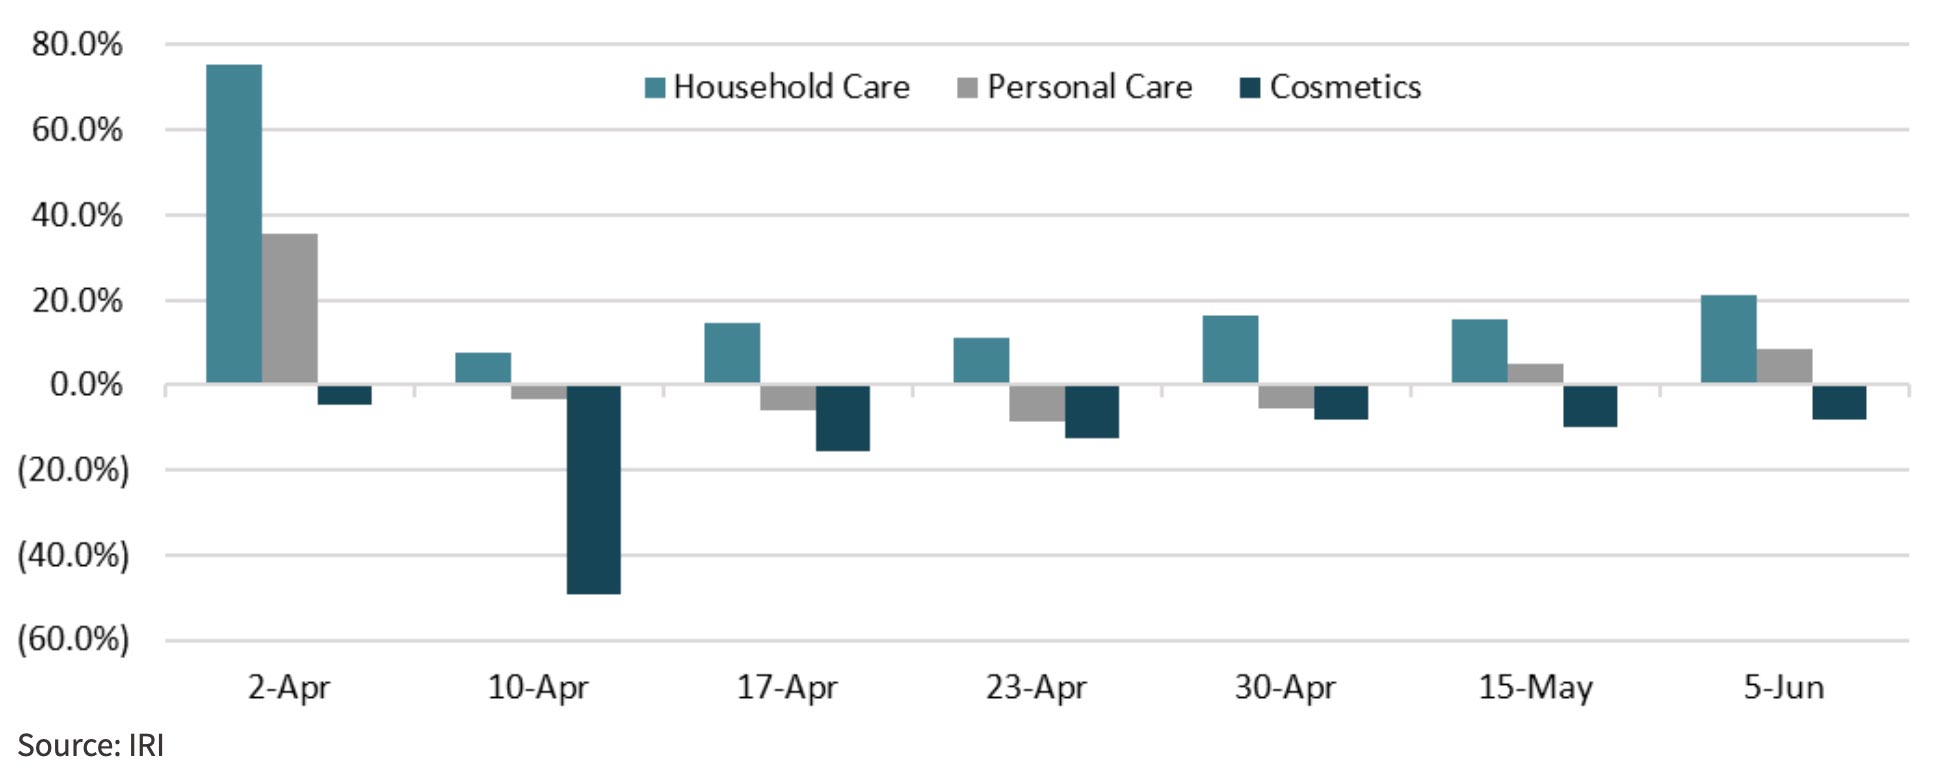
- Trends have stabilized somewhat after the initial stockpiling of household care products and hand sanitizer in late March and early April
- Heightened demand for household care products persists as Americans remain more concerned about home cleanliness than they did pre-pandemic
- Sales of personal care products are recovering from their April-May slump
- Consumer expenditures on cosmetics remain about 8% below pre-pandemic levels
U.S. Consumer Expenditures by Category: % Change vs. One Year Ago
A Greater Portion of U.S. Retail Purchases Are Occurring Online
- Total retail expenditures are trending back towards pre-pandemic levels
- Online purchases of consumer goods have declined slightly over the past few weeks but remain well above the pre-crisis baseline
Per-Capita Receipt Index by Purchase Method Relative to Pre-Crisis Baseline
COVID-19 Long-term Impact on Household and Personal Care Products
Some changes resulting from the pandemic are likely to survive over the longer term. Here are some trends that may endure, and how they will shape consumer demand in the future.
Heightened Focus on Household Care and Personal Hygiene
In household care and personal hygiene products, the pandemic has made consumers more aware of the need to maintain personal hygiene as well as a clean household, with an enhanced focus on ingredients that are safe, natural, and green. Trust will become increasingly important to consumers, allowing innovative and appealing brands to capture market share and loyalty.
Shifting Priorities for “Nice to Have” Personal Care Items
Sales of personal care staples such as shampoo and deodorant will continue to remain relatively steady. Discretionary personal care items and premium brands will likely continue to see decreased sales in the near- to medium-term, as a struggling economy prompts consumers to tighten their budgets. Consumers will look to budget-friendly pampering to ease stress and boost their mood, and affordable, wellness-oriented luxuries could be a bright spot among personal care products for the foreseeable future.
Changing Form of Color Cosmetics
Already experiencing long-term declines in sales, traditional color cosmetics are likely to fall further out of favor, particularly among younger generations. Women continue to favor a natural look, using less makeup and focusing instead on skincare to achieve a naturally radiant glow. Light touch, hybrid skincare/makeup solutions, such as moisturizing foundation, will gain popularity over traditional makeup offerings. A heightened awareness of personal wellness and safety will further the popularity of clean and natural beauty products.
The Rise of DIY Beauty
DIY beauty categories such as hair dye and nail care have found new customers amidst shuttered beauty salons and tightening budgets. Innovative products that can produce salon-quality results at a more accessible price point are well-positioned to develop loyal customer relationships.
E-Commerce Trends Accelerated
The increased use of e-commerce is almost certain to drive a lasting change in consumer behavior. Now is the time for consumer brands to optimize their e-commerce strategy. It is imperative that businesses ensure operational preparedness to fulfill and deliver an increased number of online orders, and to manage customer expectations accordingly. Developing digital communications and messaging that resonates with the mindset of today’s consumer can help businesses form new customer relationships and build brand trust.
Publicly-Traded Household and Personal Care Companies
Household Care Products
| Company Name | Market Cap | Enterprise Value | TTM Revenue | TTM EBITDA | TTM EBITDA Margin | TTM y/y Revenue Growth % | Enterprise Value / TTM Revenue | Enterprise Value / TTM EBITDA | 6-Mo. Share Price Change |
|---|---|---|---|---|---|---|---|---|---|
| Reckitt Benckiser Group plc | $61,757.2 | $75,795.9 | $16,389.6 | ($1,731.3) | 2.0% | (10.6%) | 4.6x | nm | 8.3% |
| Colgate-Palmolive Co | 62,346.7 | 69,792.7 | 15,906.0 | 4,047.0 | 3.1% | 25.4% | 4.4x | 17.2x | 6.0% |
| Kimberly-Clark Corp. | 46,294.0 | 54,005.0 | 18,826.0 | 4,045.0 | 2.4% | 21.5% | 2.9x | 13.4x | 0.0% |
| The Clorox Company | 25,831.5 | 28,603.5 | 6,365.0 | 1,358.0 | 1.4% | 21.3% | 4.5x | 21.1x | 35.2% |
| Church & Dwight Co Inc | 17,969.8 | 19,705.9 | 4,478.2 | 1,104.1 | 7.0% | 24.7% | 4.4x | 17.8x | 4.4% |
| Median | $46,294.0 | $54,005.0 | $15,906.0 | $1,358.0 | 2.4% | 21.5% | 4.4x | 17.5x | 6.0% |
| Average | $42,839.9 | $49,580.6 | $12,393.0 | $1,764.6 | 3.2% | 16.5% | 4.2x | 17.4x | 10.8% |
Personal Care Products
| Company Name | Market Cap | Enterprise Value | TTM Revenue | TTM EBITDA | TTM EBITDA Margin | TTM y/y Revenue Growth % | Enterprise Value / TTM Revenue | Enterprise Value / TTM EBITDA | 6-Mo. Share Price Change |
|---|---|---|---|---|---|---|---|---|---|
| Procter & Gamble Co. | $286,233.8 | $308,152.8 | $70,346.0 | $10,561.0 | 4.8% | 15.0% | 4.4x | 29.2x | (7.9%) |
| Unilever Nederland B.V. | 126,764.8 | 153,006.0 | 58,188.7 | 12,049.7 | 2.0% | 20.7% | 2.6x | 12.7x | (11.8%) |
| Edgewell Personal Care LLC | 1,476.4 | 2,332.8 | 2,114.2 | (253.5) | (2.2%) | (12.0%) | 1.1x | nm | (13.8%) |
| Median | $126,764.8 | $153,006.0 | $58,188.7 | $10,561.0 | 2.0% | 15.0% | 2.6x | 20.9x | (11.8%) |
| Average | $138,158.3 | $154,497.2 | $43,549.6 | $7,452.4 | 1.5% | 7.9% | 2.7x | 20.9x | (11.1%) |
Cosmetics
| Company Name | Market Cap | Enterprise Value | TTM Revenue | TTM EBITDA | TTM EBITDA Margin | TTM y/y Revenue Growth % | Enterprise Value / TTM Revenue | Enterprise Value / TTM EBITDA | 6-Mo. Share Price Change |
|---|---|---|---|---|---|---|---|---|---|
| Estée Lauder Companies Inc. | $68,896.5 | $72,909.5 | $15,454.0 | $2,537.0 | 6.1% | 16.4% | 4.7x | 28.7x | (5.8%) |
| Ulta Beauty, Inc. | 12,761.9 | 14,397.1 | 6,828.2 | 862.5 | (1.3%) | 12.6% | 2.1x | 16.7x | (10.6%) |
| Coty, Inc. | 3,716.3 | 12,657.2 | 7,931.2 | (2,116.9) | (10.2%) | (26.7%) | 1.6x | nm | (56.0%) |
| Revlon, Inc. | 550.1 | 3,771.5 | 2,319.4 | 9.6 | (9.3%) | 0.4% | 1.6x | nm | (53.8%) |
| e.l.f. Cosmetics, Inc. | 845.2 | 952.0 | 282.9 | 52.5 | 5.7% | 18.6% | 3.4x | 18.1x | 13.9% |
| Median | $3,716.3 | $12,657.2 | $6,828.2 | $52.5 | (1.3%) | 12.6% | 2.1x | 18.1x | (10.6%) |
| Average | $17,354.0 | $20,937.5 | $6,563.1 | $268.9 | (1.8%) | 4.3% | 2.7x | 21.2x | (22.5%) |
Precedent Transactions: Household Care Products
| Date | Target | Target Business Description | Buyer | Enterprise Value ($M) | Enterprise Value / Revenue | Enterprise Value / EBITDA |
|---|---|---|---|---|---|---|
| Jan-19 | The Laundress | Provides an eco-friendly line of detergent, fabric care, and home cleaning products | Unilever | $100.0 | – | – |
| Jul-18 | Prestige Brands Holdings Household Cleaning Business | Includes the Comet, Spic & Span, Cinch, Chore Boy, and Chlorinol household product brands | KIK Custom Products | 69.0 | 0.9x | 5.9x |
| Nov-17 | NEST Fragrances | Provides home and personal care products including scented candles, room sprays, soaps, and lotions | Eurazeo Brands | 70.0 | 0.9x | – |
| Feb-17 | HG International | European supplier of specialist consumer cleaning and maintenance products marketed under the HG name | Cobepa SA | 250.0 | 3.8x | 17.1x |
| Sep-16 | 7th Generation | Manufactures plant-based detergents and household cleaners | Unilever | 700.0 | 3.5x | – |
| Jun-16 | Sun Products Corporation | U.S.-based manufacturer of laundry detergent, fabric softeners, and other household care products | Henkel North American Consumer Goods | 3,600.0 | 2.3x | 18.8x |
| Household Care Products Median | $175.0 | 2.3x | 17.1x | |||
| Household Care Products Average | $798.2 | 2.3x | 13.9x |
Precedent Transactions: Household Care Products
| Date | Target | Target Business Description | Buyer | Enterprise Value ($M) | Enterprise Value / Revenue | Enterprise Value / EBITDA |
|---|---|---|---|---|---|---|
| Dec-19 | Dr. Jart+ | Manufacturer and supplier of skin care products based in Seoul, South Korea | The Estée Lauder Companies | $1,902.0 | 3.8x | – |
| Dec-19 | DevaCurl | Provider of haircare products for curly hair | Henkel | 505.5 | 5.4x | – |
| Nov-19 | The Mane Choice | Manufactures and supplies hair care products | MAV Beauty Brands | 38.0 | 1.6x | 5.9x |
| Nov-19 | Drunk Elephant | Manufactures, markets and distributes a range of premium skin care products | Shiseido Americas | 845.0 | 11.3x | – |
| Sep-19 | Oars + Alps | Producer and retailer of men’s skincare products | SC Johnson | 20.0 | – | – |
| Sep-19 | Redwood Holding Group | Manufacturer and distributor of hemp-derived CBD infused skincare and other consumer products | Cronos Group | 300.0 | – | – |
| Aug-19 | New Avon | Producer and retailer of skincare, color cosmetics, fragrance, and personal care products | LG Household & Health Care | 125.0 | – | – |
| Jul-19 | Tatcha | Operator of a luxury skincare brand with a collection of products | Unilever | 500.0 | 5.0x | – |
| Jul-19 | Nestle Skin Health | Skincare products including the Cetaphil and Proactiv product lines and prescription dermatology medicines | Consortium led by EQT Partners | 10,100.0 | 3.6x | 18.0x |
| Jul-19 | Ranir | Manufacturer of consumer oral care products including power toothbrushes and tooth whiteners | Perrigo Company | 750.0 | 2.6x | – |
| Jun-19 | Sun Bum | Manufacturer and seller of sun care products | SC Johnson | 400.0 | 5.7x | – |
| Mar-19 | Envy Medical | Developer of skincare products | Allergan | 81.4 | – | – |
| Mar-19 | ELEMIS | Provider of skincare products and treatments in the United Kingdom | L’Occitane International | 900.0 | 4.9x | 16.4x |
| Feb-19 | This is L. | Provider of personal care products | Procter & Gamble | 100.0 | – | – |
| Personal Care Products Median | $450.0 | 4.3x | 16.4x | |||
| Personal Care Products Average | $1,183.3 | 4.1x | 13.4x |
Precedent Transactions: Cosmetics
| Date | Target | Target Business Description | Buyer | Enterprise Value ($M) | Enterprise Value / Revenue | Enterprise Value / EBITDA |
|---|---|---|---|---|---|---|
| Apr-20 | Clarins Group Fragrance Division | Operator of a luxury fragrance and cosmetic group based in Paris, France | L’Oreal | – | – | – |
| Feb-20 | W3ll People | Manufacturer and retailer of organic makeup and beauty products | E.L.F. Cosmetics | $27.0 | 3.9x | – |
| Jan-20 | Kylie Cosmetics 51% Stake | Provider of makeup products including lipsticks, lip kits, eyeshadow palettes, and highlighters | Coty | 1,176.5 | 6.7x | – |
| Jan-20 | Avon Products | Manufacturer and distributor of beauty products worldwide | Natura Cosmetics | 2,161.4 | 0.5x | 6.2x |
| Aug-19 | Morphe | Manufactures and markets a range of beauty products including lipsticks, pigments, and brushes | General Atlantic, Sofina | 3,666.7 | 7.3x | 28.2x |
| Apr-19 | Coty 20% Stake | Global beauty company offering cosmetics, skin, fragrance, and haircare brands | JAB Holding Company | 8,737.5 | 1.0x | 9.8x |
| Cosmetics Median | $2,161.4 | 3.9x | 9.8x | |||
| Cosmetics Average | $3,153.8 | 3.8x | 14.7x |

